其实就一句话:
backgroundColor: 'rgba(0,0,0,0)'
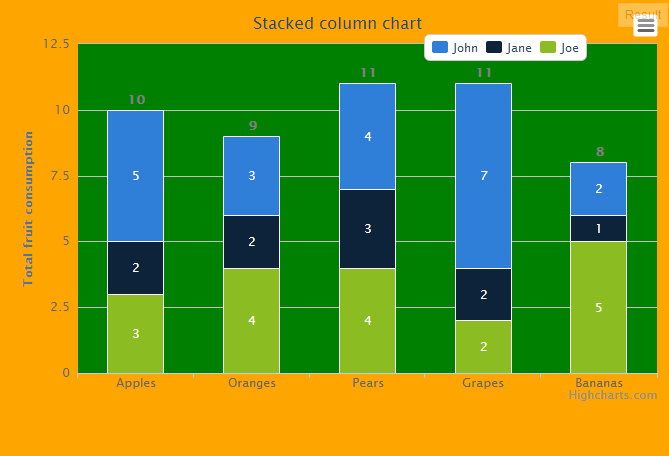
完整示例:
$(function () {
        $('#container').highcharts({
            chart: {
                type: 'column',
                backgroundColor: 'rgba(0,0,0,0)'
            },
            title: {
                text: 'Stacked column chart'
            },
            xAxis: {
                categories: ['Apples', 'Oranges', 'Pears', 'Grapes', 'Bananas']
            },
            yAxis: {
                min: 0,
                title: {
                    text: 'Total fruit consumption'
                },
                stackLabels: {
                    enabled: true,
                    style: {
                        fontWeight: 'bold',
                        color: (Highcharts.theme && Highcharts.theme.textColor) || 'gray'
                    }
                }
            },
            legend: {
                align: 'right',
                x: -70,
                verticalAlign: 'top',
                y: 20,
                floating: true,
                backgroundColor: (Highcharts.theme && Highcharts.theme.legendBackgroundColorSolid) || 'white',
                borderColor: '#CCC',
                borderWidth: 1,
                shadow: false
            },
            tooltip: {
                formatter: function() {
                    return '<b>'+ this.x +'</b><br/>'+
                        this.series.name +': '+ this.y +'<br/>'+
                        'Total: '+ this.point.stackTotal;
                }
            },
            plotOptions: {
                column: {
                    stacking: 'normal',
                    dataLabels: {
                        enabled: true,
                        color: (Highcharts.theme && Highcharts.theme.dataLabelsColor) || 'white'
                    }
                }
            },
            series: [{
                name: 'John',
                data: [5, 3, 4, 7, 2]
            }, {
                name: 'Jane',
                data: [2, 2, 3, 2, 1]
            }, {
                name: 'Joe',
                data: [3, 4, 4, 2, 5]
            }]
        });
    });
还有另外一个属性,plotBackgroundColor: null
这个属性的意思是指图表部分,不含标题、说明信息,x轴y轴上的提示信息等部分的背景色,例如: