1.多项式拟合
对散点进行多项式拟合并打印出拟合函数以及拟合后的图形
import matplotlib.pyplot as plt
import numpy as np
x=np.arange(1,17,1) #生成散点列表作为x的值
y=np.array([4.00, 6.40, 8.00, 8.80, 9.22, 9.50, 9.70, 9.86, 10.00, 10.20, 10.32, 10.42, 10.50, 10.55, 10.58, 10.60]) #给定y的散点值
#用3次多项式拟合
z1=np.polyfit(x,y,3)
p1=np.poly1d(z1)
print(p1) #打印拟合的多项式
yvals=p1(x) #拟合后的y值
plot1=plt.plot(x,y,'r*',label='original values')
plot2=plt.plot(x,yvals,'b',label='polyfit values')
plt.xlabel('X ')
plt.ylabel('Y')
# 'best'         : 0, (only implemented for axes legends)(自适应方式)
# 'upper right'  : 1,
# 'upper left'   : 2,
# 'lower left'   : 3,
# 'lower right'  : 4,
# 'right'        : 5,
# 'center left'  : 6,
# 'center right' : 7,
# 'lower center' : 8,
# 'upper center' : 9,
# 'center'       : 10,
plt.legend(loc=3) #设置图示的位置
plt.title('polyfitting') #设置标题
plt.show() #显示图片
plt.savefig('p1.png')

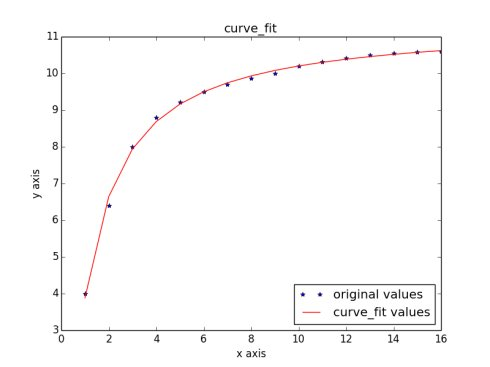
2.指定函数拟合
#使用非线性最小二乘法拟合
import matplotlib.pyplot as plt
from scipy.optimize import curve_fit
import numpy as np
#用指数形式来拟合
x = np.arange(1, 17, 1)
y = np.array([4.00, 6.40, 8.00, 8.80, 9.22, 9.50, 9.70, 9.86, 10.00, 10.20, 10.32, 10.42, 10.50, 10.55, 10.58, 10.60])
def func(x,a,b):
return a*np.exp(b/x)
popt, pcov = curve_fit(func, x, y)
a=popt[0]#popt里面是拟合系数,读者可以自己help其用法
b=popt[1]
yvals=func(x,a,b)
plot1=plt.plot(x, y, '*',label='original values')
plot2=plt.plot(x, yvals, 'r',label='curve_fit values')
plt.xlabel('x axis')
plt.ylabel('y axis')
plt.legend(loc=4)#指定legend的位置,读者可以自己help它的用法
plt.title('curve_fit')
plt.show()
plt.savefig('p2.png')