弦截法:
若 ![]() 在区间
在区间 ![]() 上连续且
上连续且 ![]() ,则
,则 ![]() 在区间
在区间 ![]() 有解。不妨假设其解为
有解。不妨假设其解为 ![]() ,当
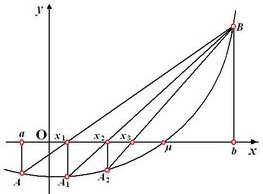
,当![]() 不是简单多项式时,无法求出其精确解,这时可以利用弦截法来求其近似解。由于过
不是简单多项式时,无法求出其精确解,这时可以利用弦截法来求其近似解。由于过 ![]() 和
和 ![]() 两点的直线
两点的直线 ![]() 的方程为
的方程为 ![]() ,将直线与
,将直线与 ![]() 轴交点的横坐标
轴交点的横坐标 ![]() 取作方程
取作方程 ![]() 在含根区间
在含根区间 ![]() 上解
上解 ![]() 的近似值,然后不断地迭代直到近似解满足所需的精度即可。
的近似值,然后不断地迭代直到近似解满足所需的精度即可。
如图所示:
cpp 实现:
// CppDemo.cpp : 定义控制台应用程序的入口点。
//

#include "stdafx.h"
#include<iostream>
#include<iomanip>
#include<math.h>
using namespace std;

float f(float x)                    // 求 y 函数
{
    float y;
    y = ((x - 5.0)*x + 16.0)*x - 80.0;
    return y;
}

float newx(float x1, float x2)    // 求 x 的下一迭代值
{
    float x;
    x = (x1*f(x2) - x2*f(x1)) / (f(x2) - f(x1));
    return x;
}

float root(float x1, float x2)         // 求根函数
{
    float x, y, y1;
    y1 = f(x1);                        // 先固定(x1,y1),并不断调整(x2,y2)
    for(y = y1; fabs(y) >= 0.001; ) // 循环求解,判断精度是否满足需求
    {
        x = newx(x1, x2);            // 下一迭代值 x
        y = f(x);                    // x 对应的 y 值

        if(y*y1 > 0)                // 如果新点(x,y)和(x1,y1)在 x 轴的同侧,则替换(x1,y1)
        {
            y1 = y;
            x1 = x;
        }
        else
        {
            x2 = x;
        }
    }
    return x;
}

int _tmain(int argc, _TCHAR* argv[])
{
    float x1, x2, f1, f2, x;

    do{
        cout<<"请输入 x1, x2 按空格分割:"<<endl;
        cin>>x1>>x2;
        f1 = f(x1);
        f2 = f(x2);
    }while(f1*f2 >= 0);

    x = root(x1, x2);

    cout<<"此方程的根是"<<x<<endl;

    return 0;
}
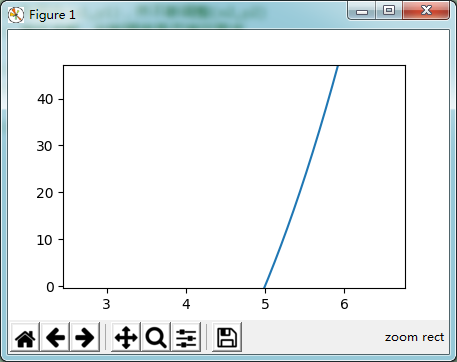
python 近似图:
#运行此程序需先安装 matplotlib 包
#python -m pip install -U pip
#python -m pip install -U matplotlib
import matplotlib.pyplot as plt
import numpy as np

x=np.linspace(-10,10,10000)
y=((x - 5.0)*x + 16.0)*x - 80.0
plt.plot(x,y)
plt.show()
附件:心形图(来自抖音视频)
#运行此程序需先安装 matplotlib 包
#python -m pip install -U pip
#python -m pip install -U matplotlib
import matplotlib.pyplot as plt
import numpy as np

x=np.linspace(-1.816,1.816,100000)
y=np.power(x*x,1/3)+0.9*np.power((3.3-x*x),1/2)*np.sin(128*x)
plt.title(' ',color='red')
plt.plot(x,y,color='red')
plt.show()
参考资料:
cpp程序来源:《Visual c++编程从基础到应用》 第3章末尾
弦截法图片来源:https://baike.baidu.com/item/%E5%BC%A6%E6%88%AA%E6%B3%95/1195626?fr=aladdin
matplotlib 下载地址:https://matplotlib.org/users/installing.html
https://www.jianshu.com/p/538b5e776405
https://realpython.com/python-matplotlib-guide/