导入依赖包
import tensorflow as tf
import numpy as np
import matplotlib.pyplot as plt
使用numpy随机生成训练数据
通过随机生成的x求出对应的y值,可以自己指定求出y值的方法,主要是使x和y有对应的关系
# 使用mumpy生成200个随机点
x_data = np.linspace(-0.5, 0.5, 200)[:, np.newaxis]  # 使得维度为[200,1]
noise = np.random.normal(0, 0.02, x_data.shape)  # 维度为[200, 1]高斯分布的数据
y_data = np.square(x_data) + noise
构建我们的网络
# 定义权重和偏置第一层
w1 = tf.Variable(tf.random.normal([1, 10],dtype=x_data.dtype))
b1 = tf.Variable(tf.zeros([1, 10], dtype=x_data.dtype))

# 定义输出
w2 = tf.Variable(tf.random.normal([10, 1], dtype=x_data.dtype))
b2 = tf.Variable(tf.zeros([1, 1], dtype=x_data.dtype))
定义超参数
可以试着改变一下超参数,对比不同的参数训练的结果是什么样的
# 定义超参数
epochs = 1000  # 训练次数
lr = 0.1
train_loss_results = []  # 训练损失结果列表,用来画图展示
开始训练
for epoch in range(epochs):
    with tf.GradientTape() as tape:  # 记录梯度信息

        y1 = tf.matmul(x_data, w1) + b1
        l1 = tf.nn.tanh(y1)  # 使用tanh激活函数,使得结果都为正数


        y2 = tf.matmul(l1, w2) + b2
        l2 = tf.nn.tanh(y2)  # 使用tanh激活函数

        # 使用均方误差求损失值
        loss = tf.reduce_mean(tf.square(y_data - l2))

        # 计算梯度下降的方向
        grads = tape.gradient(loss, [w1, b1, w2, b2])
        w1.assign_sub(lr * grads[0])
        b1.assign_sub(lr * grads[1])
        w2.assign_sub(lr * grads[2])
        b2.assign_sub(lr * grads[3])
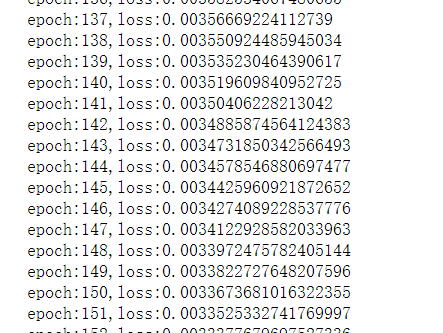
        print(f"epoch:{epoch},loss:{loss}")

        train_loss_results.append(loss)  # 记录每次的loss

通过训练的权值,求出y_pred
y_pred = tf.matmul(x_data, w1) + b1
l1 = tf.nn.tanh(y_pred)

y_pred = tf.matmul(l1, w2) + b2
y_pred = tf.nn.tanh(y_pred)
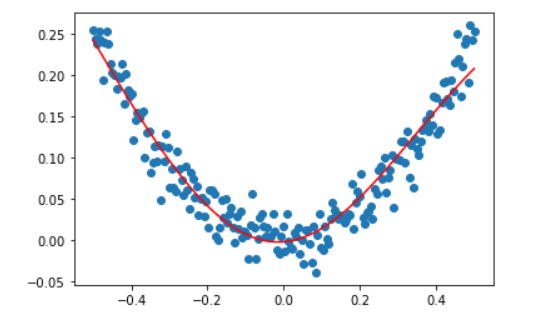
画图查看训练结果
plt.scatter(x_data, y_data)
plt.plot(x_data, y_pred, c='r')
plt.show()

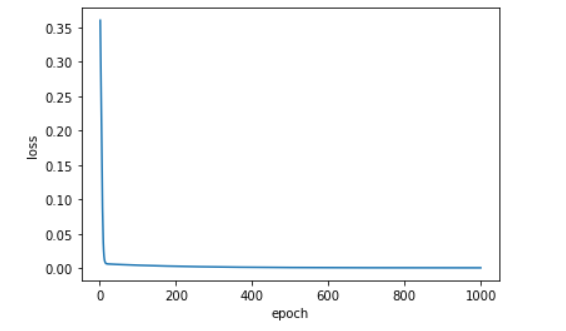
查看loss
x_epoch = np.arange(1, epochs+1)
plt.plot(x_epoch, train_loss_results)
plt.xlabel('epoch')
plt.ylabel('loss')
plt.show()
