一、blackbox_exporter应用场景
HTTP 测试: 定义 Request Header 信息、判断 Http status / Http Respones Header / Http Body 内容
TCP 测试: 业务组件端口状态监听、应用层协议定义与监听
ICMP 测试: 主机探活机制
POST 测试: 接口联通性
SSL证书过期时间
二、blackbox_exporter安装

# wget https://github.com/prometheus/blackbox_exporter/releases/download/v0.16.0/blackbox_exporter-0.16.0.linux-amd64.tar.gz

# tar xf blackbox_exporter-0.16.0.linux-amd64.tar.gz -C /usr/local/
# ln -s /usr/local/blackbox_exporter-0.16.0.linux-amd64/ /usr/local/blackbox_exporter

# 使用systemd进行管理blackbox_exporter服务
# vim /usr/lib/systemd/system/blackbox_exporter.service
[Unit]
Description=blackbox_exporter
After=network.target

[Service]
User=root
Type=simple
ExecStart=/usr/local/blackbox_exporter/blackbox_exporter --config.file=/usr/local/blackbox_exporter/blackbox.yml
Restart=on-failure

[Install]
WantedBy=multi-user.target

# systemctl daemon-reload
# systemctl start blackbox_exporter.service
# systemctl enable blackbox_exporter.service
三、配置prometheus采集数据
# cd /usr/local/prometheus
# vim prometheus.yml
# my global config
global:
  scrape_interval:     15s
  evaluation_interval: 15s
alerting:
  alertmanagers:
  - static_configs:
    - targets:
rule_files:
  # - "first_rules.yml"
  # - "second_rules.yml"
scrape_configs:
  - job_name: 'prometheus'

    static_configs:
    - targets: ['192.168.5.237:9090']

  - job_name: 'node'
    file_sd_configs:
    - refresh_interval: 30s
      files:
      - "/usr/local/prometheus/sd_config/node*.yml"

  - job_name: 'docker'
    static_configs:
    - targets: ['192.168.5.85:8080']

  - job_name: 'mysql'
    static_configs:
    - targets: ['192.168.5.237:9104']
      labels:
        app: zabbix-server-mysql

# 网站监控
  - job_name: 'http_status'
    metrics_path: /probe
    params:
      module: [http_2xx]
    static_configs:
      - targets: ['http://www.lzfn.com', 'wiki.lzfn.com']
        labels:
          instance: http_status
          group: web
    relabel_configs:
      - source_labels: [__address__]
        target_label: __param_target
      - target_label: __address__
        replacement: 192.168.5.85:9115

# ping 检测
  - job_name: 'ping_status'
    metrics_path: /probe
    params:
      module: [icmp]
    static_configs:
      - targets: ['192.168.5.85']
        labels:
          instance: 'ping_status'
          group: 'icmp'
    relabel_configs:
      - source_labels: [__address__]
        target_label: __param_target
      - target_label: __address__
        replacement: 192.168.5.85:9115

# 端口监控
  - job_name: 'port_status'
    metrics_path: /probe
    params:
      module: [tcp_connect]
    static_configs:
      - targets: ['192.168.5.85:80', '192.168.5.85:9000', '192.168.5.85:8080']
        labels:
          instance: 'port_status'
          group: 'port'
    relabel_configs:
      - source_labels: [__address__]
        target_label: __param_target
      - target_label: __address__
        replacement: 192.168.5.85:9115

# 检查配置文件并重启服务
# ./promtool check config prometheus.yml
Checking prometheus.yml
  SUCCESS: 0 rule files found

# systemctl restart prometheus.service
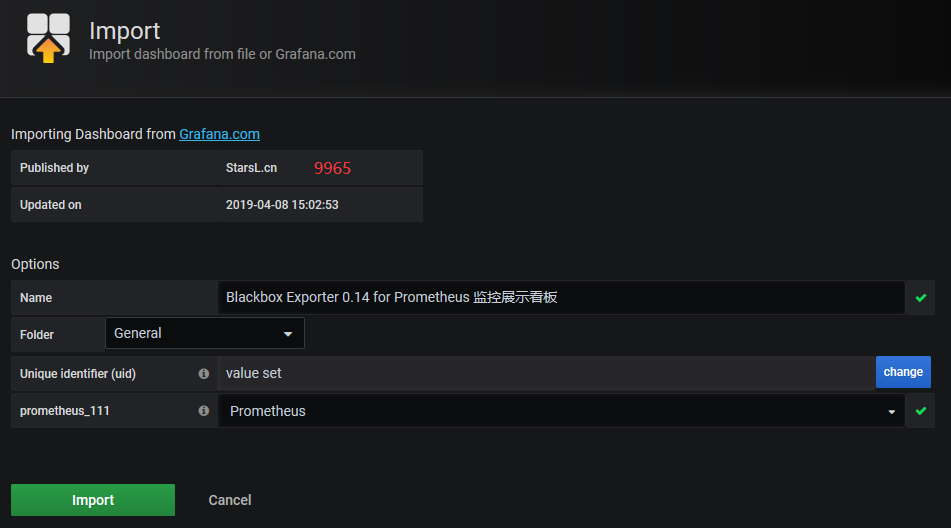
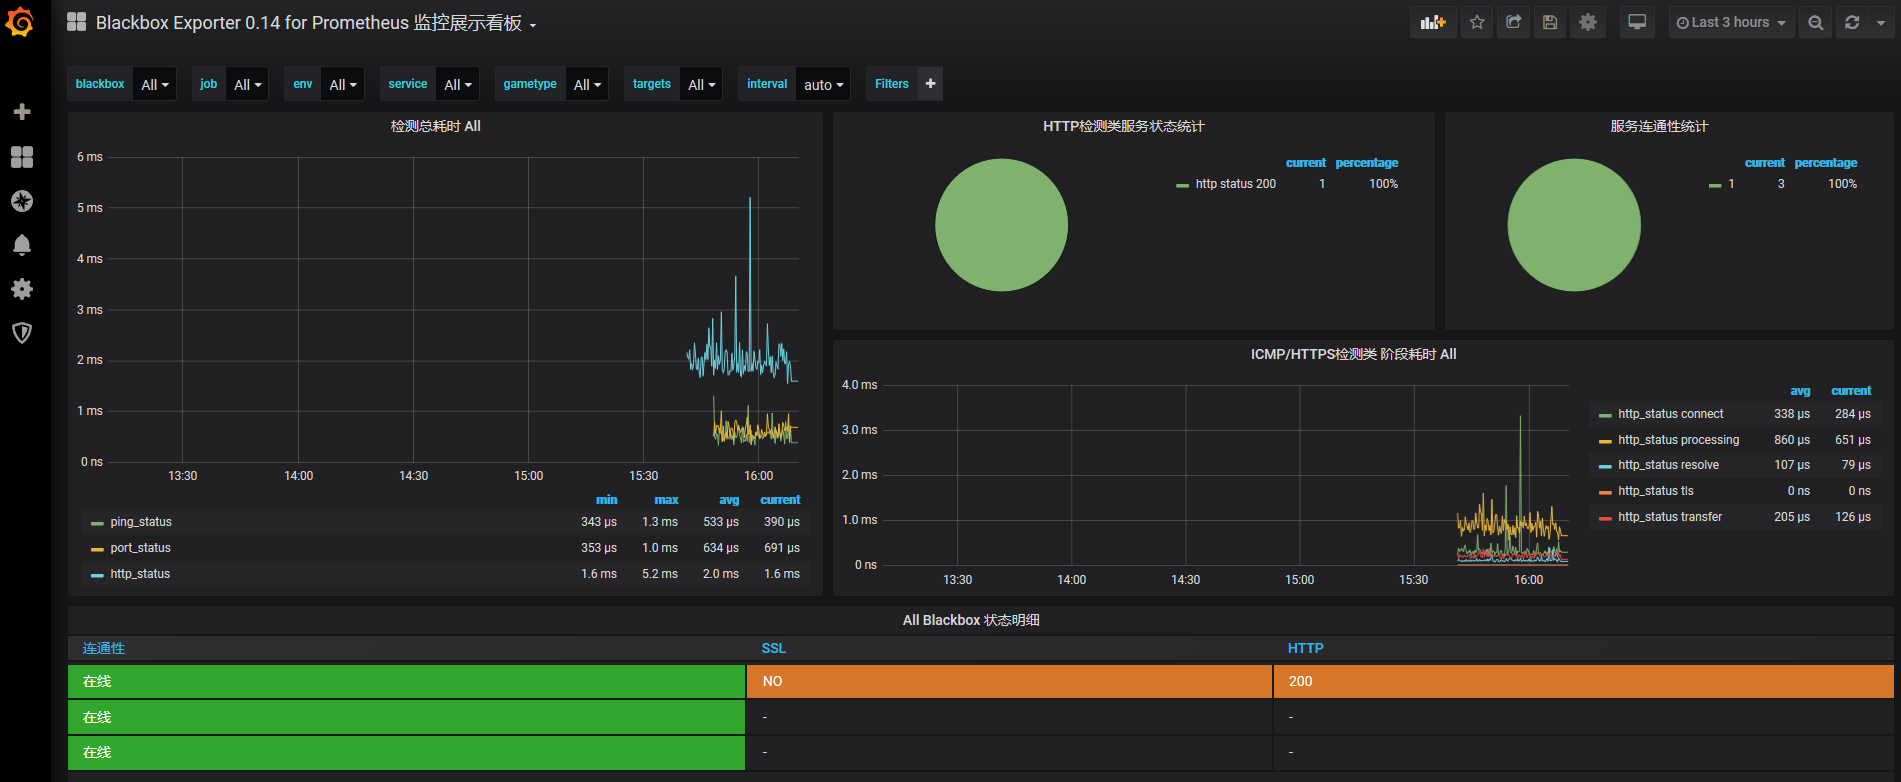
四、配置Grafana展示数据
使用9965模板,需要安装饼状态图插件,安装后重启grafana
grafana-cli plugins install grafana-piechart-panel
systemctl restart grafana-server.service