step_1:目标确定
通过问卷调查数据,选取其中多组变量来预测其对幸福感的评价。
step_2:数据获取
连接:
https://tianchi.aliyun.com/competition/entrance/231702/information
下载:
train_set:happiness_train_complete.csv
test_set:happiness_test_complete.csv
index:文件中包含每个变量对应的问卷题目,以及变量取值的含义
survey:文件是数据源的原版问卷,作为补充以方便理解问题背景
step_3:train_set数据清洗和整理
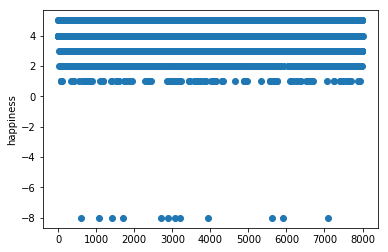
使用matplotlib.pyplot依次画出id和其它列的scatter图

通过图对数据进行操作:
- happiness是样本标签(预测模型的真实值),通过问卷发现其类别只有1,2,3,4,5,通过图发现有-8,应当删除值为-8这些噪音数据
- 删除id、survey_time、edu_other、join_party、property_other、invest_other列
- 其它列所有小于0的值和空值均设置为-8
- 均值归一化

# jupyter notebook下运行

import numpy as np
import pandas as pd
import matplotlib.pyplot as plt

# 导入训练数据集和测试集
# encoding='gbk',不能用utf-8
train_data = pd.read_csv('happiness_train_complete.csv', encoding='gbk')
test_data = pd.read_csv('happiness_test_complete.csv', encoding='gbk')

# 训练集样本个数8000,每个样本含有140个特征
# 测试集样本个数2968,每个样本含有139个特征
train_data.shape
test_data.shape

# 去除-8值
train_data = train_data[train_data.happiness>0]
train_data.shape

# 训练集标签
y = train_data.happiness

ind1 = ['id','happiness','survey_time','edu_other','join_party','property_other','invest_other']
# 训练集样本中删除指定列数据
X = train_data.drop(ind, axis=1)

# 删除测试集中删除指定列数据
ind2 = ['id','survey_time','edu_other','join_party','property_other','invest_other']
X_test_data = test_data.drop(ind, axis=1)

# 把DateFrame类型转为np.array
y = np.array(y, dtype=int)
X = np.array(X, dtype=float)
X_test_data = np.array(X_test_data, dtype=float)

# 把小于0的值设置为-8
X[X<0]=-8
X_test_data[X_test_data<0]=-8

from sklearn.impute import SimpleImputer

# 把样本中的值为空的特征设置为-8
X = SimpleImputer(fill_value=-8).fit_transform(X)
X_test_data = SimpleImputer(fill_value=-8).fit_transform(X_test_data)

from sklearn.model_selection import train_test_split

# 因为测试集没有标签,所以拆分训练集
X_train, X_test, y_train, y_test = train_test_split(X,y, random_state=666)

# 均值归一化
from sklearn.preprocessing import StandardScaler

std = StandardScaler().fit(X_train)
X_train_std = std.transform(X_train)
X_test_std = std.transform(X_test)
std_1 = StandardScaler().fit(X)
X_std = std_1.transform(X)
X_test_data = std_1.transform(X_test_data)
step_4:选择算法并实现模型
这是一个分类问题初步定为使用KNN算法来进行建模

from sklearn.neighbors import KNeighborsClassifier
from sklearn.model_selection import GridSearchCV

param_grid = [
    {
         'weights': ['uniform'],
       'n_neighbors':[i for i in range(1,11)]
   },
    {
         'weights': ['distance'],
       'n_neighbors': [i for i in range(1,11)],
       'p': [i for i in range(1,6)]
}]

# 网格搜索优化超参数
knn_clf_grid = KNeighborsClassifier()
grid_search = GridSearchCV(knn_clf_grid, param_grid,n_jobs=-1, verbose=2).fit(X_train_std, y_train)

# 最优超参数为:{'n_neighbors': 10, 'p': 1, 'weights': 'distance'}
grid_search.best_estimator_
grid_search.best_params_
grid_search.best_score_

# 使用真正测试集加载模型
knn = KNeighborsClassifier(n_neighbors=10, p=1, weights='distance').fit(X_std, y)
y_pre = knn.predict(X_test_data)

# 把预测结果写入文件
df = pd.DataFrame({'id':test_data.id, 'happniess': y_pre})
df.to_csv('forecast_3.csv', index=None)
提交结果到天池等待评测分数结果score=0.6814
结果提交3次:
第一次:score=1.3260
第二次:数据均值归一化score=0.9629
第三次:数据均值归一化+网格搜索优化超参数score=0.6814
第四次:数据均值归一化+PCA+逻辑回归(OvO)score=0.6099

import numpy as np
import pandas as pd

# 导入train_set和test_set, encoding='gbk',不能用utf-8
train_set = pd.read_csv('happiness_train_complete.csv', encoding='gbk')
test_set = pd.read_csv('happiness_test_complete.csv', encoding='gbk')

# 去除标签中不合理的数据 -8
train_set = train_set[train_set.happiness>0]

y_label = train_set.happiness
ind1 = ['id','happiness','survey_time','edu_other','join_party','property_other','invest_other']
X_train_set = train_set.drop(ind1, axis=1)

ind2 = ['id','survey_time','edu_other','join_party','property_other','invest_other']
X_test_set = test_set.drop(ind2, axis=1)

y_label = np.array(y_label, dtype=int)
X_train_set = np.array(X_train_set, dtype=float)
X_test_set = np.array(X_test_set, dtype=float)

from sklearn.impute import SimpleImputer

# 空值设置为-1
X_train_set = SimpleImputer(fill_value=-1).fit_transform(X_train_set)
X_test_set = SimpleImputer(fill_value=-1).fit_transform(X_test_set)

# # 小于0的值设置为-1
X_train_set[X_train_set < 0] = -1
X_test_set[X_test_set < 0] = -1

from sklearn.preprocessing import StandardScaler

# 均值归一化
std = StandardScaler().fit(X_train_set)
X_train__std = std.transform(X_train_set)
X_test__std = std.transform(X_test_set)

# PCA降维
from sklearn.decomposition import PCA

# 包含95%的方差信息
pca = PCA(0.95)
pca.fit(X_train__std)

X_train_pca = pca.transform(X_train__std)
X_test_pca = pca.transform(X_test__std)

from sklearn.model_selection import train_test_split

X_train, X_test, y_train, y_test = train_test_split(X_train_pca, y_label, random_state=666)

from sklearn.linear_model import LogisticRegression

best_c = 0.
best_score = 0.
best_sum = 10.

for c in np.arange(0.001, 0.3, 0.001):
    log_reg2 = LogisticRegression(C=c, multi_class='multinomial', solver='newton-cg').fit(X_train, y_train)
    y_pre = log_reg2.predict(X_test)
    s = sum((y_pre-y_test)**2/len(y_test))
    score = log_reg2.score(X_test, y_test)
    if best_sum > s:
        best_sum = s
        best_c = c
        best_score = score
print('c:', best_c)
print('score:', best_score)
print('sum:', best_sum)

log_reg = LogisticRegression(C=0.01, multi_class='multinomial', solver='newton-cg').fit(X_train, y_train)
y_pre2 = log_reg.predict(X_test_pca)

df = pd.DataFrame({'id':test_set.id, 'happniess': y_pre2})
df.to_csv('log_reg_pca.csv', index=None)
