1. 获取数据并全部展示:
数据获取网址推荐:https://tushare.pro/document/1?doc_id=130
import tushare as ts
import pandas as pd
import matplotlib.pyplot as plt
from matplotlib import style

style.use('ggplot')
df = ts.get_hist_data('000001')
print(df)
输出结果:
             open   high  close    low      volume  price_change  p_change
date
2020-04-29  13.48  14.10  14.02  13.45  1108722.38          0.50      3.70
2020-04-28  13.45  13.56  13.52  13.27   771564.19          0.02      0.15
2020-04-27  13.30  13.64  13.50  13.25   936829.94          0.26      1.96
2020-04-24  13.17  13.28  13.24  13.11   566001.62          0.01      0.08
2020-04-23  13.23  13.31  13.23  13.11   646989.62          0.00      0.00
2020-04-22  13.37  13.42  13.23  13.16  1032802.75         -0.22     -1.64
2020-04-21  13.30  13.70  13.45  13.30  2122448.25          0.46      3.54
2020-04-20  12.86  13.05  12.99  12.77   818455.81          0.10      0.78
2020-04-17  12.77  13.04  12.89  12.65  1331164.75          0.21      1.66
。。。
2.存储数据到本地
import tushare as ts
import pandas as pd
import matplotlib.pyplot as plt
from matplotlib import style

#Get data and adjust display option

style.use('ggplot')
pd.set_option('display.max_columns',None)
pd.set_option('display.max_row',None)


df = ts.get_hist_data('000001')
#print(df)

#Save data to csv files and read from csv files
df.to_csv('000001.csv')
3.读取本地数据,并解决index为时间到问题
读取本地csv文件对数据:
import tushare as ts
import pandas as pd
import matplotlib.pyplot as plt
from matplotlib import style

#Get data and adjust display option

style.use('ggplot')
pd.set_option('display.max_columns',None)
pd.set_option('display.max_row',None)


df_read_from_csv=pd.read_csv('000001.csv')
print(df_read_from_csv.head())
输出结果:
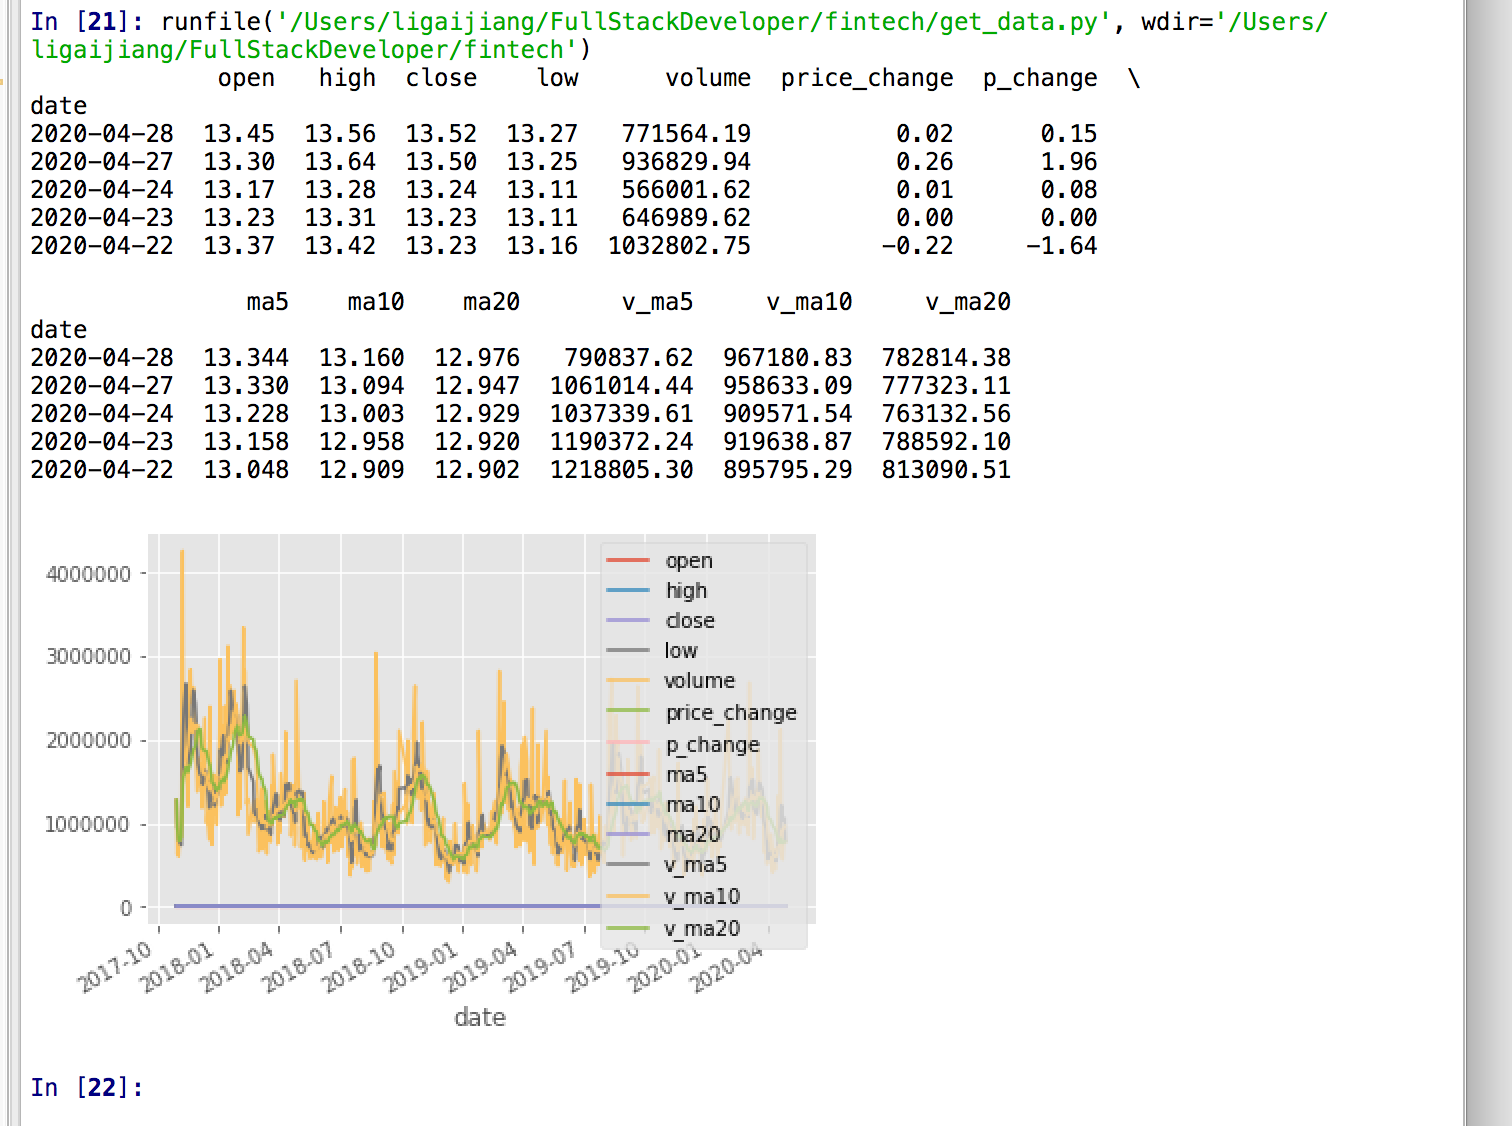
n [19]: runfile('/Users/ligaijiang/FullStackDeveloper/fintech/get_data2.py', wdir='/Users/ligaijiang/FullStackDeveloper/fintech')
date open high close low volume price_change p_change
0 2020-04-28 13.45 13.56 13.52 13.27 771564.19 0.02 0.15
1 2020-04-27 13.30 13.64 13.50 13.25 936829.94 0.26 1.96
2 2020-04-24 13.17 13.28 13.24 13.11 566001.62 0.01 0.08
3 2020-04-23 13.23 13.31 13.23 13.11 646989.62 0.00 0.00
4 2020-04-22 13.37 13.42 13.23 13.16 1032802.75 -0.22 -1.64
ma5 ma10 ma20 v_ma5 v_ma10 v_ma20
0 13.344 13.160 12.976 790837.62 967180.83 782814.38
1 13.330 13.094 12.947 1061014.44 958633.09 777323.11
2 13.228 13.003 12.929 1037339.61 909571.54 763132.56
3 13.158 12.958 12.920 1190372.24 919638.87 788592.10
4 13.048 12.909 12.902 1218805.30 895795.29 813090.51
发现以上数据对第一列不是时间,因此进行处理:
import tushare as ts
import pandas as pd
import matplotlib.pyplot as plt
from matplotlib import style

#Get data and adjust display option

style.use('ggplot')
pd.set_option('display.max_columns',None)
pd.set_option('display.max_row',None)


df_read_from_csv=pd.read_csv('000001.csv',parse_dates=True,index_col=0) #修改这一行
print(df_read_from_csv.head())
这时对输出结果:
runfile('/Users/ligaijiang/FullStackDeveloper/fintech/get_data2.py', wdir='/Users/ligaijiang/FullStackDeveloper/fintech')
            open   high  close    low      volume  price_change  p_change
date
2020-04-28  13.45  13.56  13.52  13.27   771564.19          0.02      0.15
2020-04-27  13.30  13.64  13.50  13.25   936829.94          0.26      1.96
2020-04-24  13.17  13.28  13.24  13.11   566001.62          0.01      0.08
2020-04-23  13.23  13.31  13.23  13.11   646989.62          0.00      0.00
2020-04-22  13.37  13.42  13.23  13.16  1032802.75         -0.22     -1.64

               ma5    ma10    ma20       v_ma5     v_ma10     v_ma20
date
2020-04-28  13.344  13.160  12.976   790837.62  967180.83  782814.38
2020-04-27  13.330  13.094  12.947  1061014.44  958633.09  777323.11
2020-04-24  13.228  13.003  12.929  1037339.61  909571.54  763132.56
2020-04-23  13.158  12.958  12.920  1190372.24  919638.87  788592.10
2020-04-22  13.048  12.909  12.902  1218805.30  895795.29  813090.51
4.对每日收盘价画图
import tushare as ts
import pandas as pd
import matplotlib.pyplot as plt
from matplotlib import style

#Get data and adjust display option

style.use('ggplot')
pd.set_option('display.max_columns',None)
pd.set_option('display.max_row',None)


df_read_from_csv=pd.read_csv('000001.csv',parse_dates=True,index_col=0)
print(df_read_from_csv.head())

#Use pandas to plot data
df_read_from_csv.plot()
plt.show()
画图结果:
以下画出每日收盘价的图:
import tushare as ts
import pandas as pd
import matplotlib.pyplot as plt
from matplotlib import style

#Get data and adjust display option

style.use('ggplot')
pd.set_option('display.max_columns',None)
pd.set_option('display.max_row',None)


#df = ts.get_hist_data('000001')
#print(df)

#Save data to csv files and read from csv files
#df.to_csv('000001.csv')

#df_read_from_csv=pd.read_csv('000001.csv')
#print(df_read_from_csv.head())

df_read_from_csv=pd.read_csv('000001.csv',parse_dates=True,index_col=0)
#print(df_read_from_csv.head())

#Use pandas to plot data
df_read_from_csv['close'].plot()   #画出每日收盘价的图
print(df_read_from_csv['close'])
#plt.show()
运行结果:
2019-11-08    16.65
2019-11-07    16.89
2019-11-06    16.96
2019-11-05    17.15
2019-11-04    16.92
2019-11-01    16.86
2019-10-31    16.26
2019-10-30    16.43
2019-10-29    16.91
2019-10-28    16.66
2019-10-25    16.88
2019-10-24    16.87
2019-10-23    16.45
2019-10-22    16.42
2019-10-21    16.89
2019-10-18    16.51
2019-10-17    16.70
2019-10-16    16.79
2019-10-15    17.18
2019-10-14    17.22
2019-10-11    16.81
2019-10-10    16.24
2019-10-09    16.25
2019-10-08    16.20
2019-09-30    15.59
2019-09-27    15.90
2019-09-26    15.71
2019-09-25    15.75
2019-09-24    15.18
2019-09-23    15.38
2019-09-20    15.34
2019-09-19    14.84
2019-09-18    14.41
2019-09-17    14.24
2019-09-16    14.45
2019-09-12    14.68
。。。
Name: close, dtype: float64
