1、环境准备
.pro里:
QT += charts
头文件:
#include <QtCharts>
2、在mainwindow.h里定义饼图变量
QPieSeries *series;
3、mainwindow.cpp
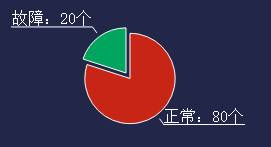
series = new QPieSeries();
series->append("故障:20个", 20);
series->append("正常:80个", 80);
series->setLabelsVisible(/*false*/);
series->setLabelsPosition(QPieSlice::LabelOutside);//label位置,里面还是外面
//series->setPieStartAngle(90);//设置开始角度和结束角度
//series->setPieEndAngle(90);
//series->setPieSize(0.5);//设置饼的大小
series->setHoleSize(0.2);//设置圆洞的大小

QPieSlice *slice_red = series->slices().at(0);
QPieSlice *slice_green = series->slices().at(1);
slice_red->setColor(QColor(199,38,22));
slice_green->setColor(QColor(0,165,94));
slice_red->setLabelColor(QColor(255,255,255));
slice_green->setLabelColor(QColor(255,255,255));
//slice_red->setExploded();//展开
QFont font;
font.setPointSize(10);
slice_red->setLabelFont(font);
slice_green->setLabelFont(font);

QChart *chart = new QChart();
chart->addSeries(series);
chart->legend()->hide();
chart->setBackgroundBrush(QBrush(QColor(34,38,72)));
chart->setAnimationOptions(QChart::AllAnimations);//设置启用或禁用动画

QChartView *chartview = new QChartView(chart);
chartview->setRenderHint(QPainter::Antialiasing);
QVBoxLayout* layout = new QVBoxLayout;
layout->addWidget(chartview);
ui->chartview1->setLayout(layout);
4、效果
ps:
设置大小setPieSize感觉没用,resize也没有用;
这个饼图用起来很难做布局,主要是大小不好设置,有时候label也不能显示;
除了自己加一个通过设置layout的方式将chartview与widget绑定,也可以
chartview->setParent(ui->chartview1);
chartview->show();