WebKit Remote Debugging
Posted by Pavel Feldman on Monday, May 9th, 2011 at 8:13 amAs you might know, WebKit Web Inspector is implemented as an HTML + CSS + JavaScript web application. What you might not know is that Web Inspector can run outside of the browser environment and still provide complete set of its features to the end user.
Debugging over the wire
Running debugger outside the browser is interesting because mobile platforms do not often provide enough screen real estate for quality debugging; they have network stack and CPU specifics that often affect page load and runtime. Still, they are based on the WebCore rendering engine, they could have Web Inspector instrumentation running and hence expose valuable debugging information to the end user. Now that Web Inspector is functioning out-of-process over the serialized-message-channel, attaching Web Inspector window to the remote browser is possible. Here is an example of the remote debugging session using Chromium:
1. Start your target browser with the remote-debugging-port command line switch:
Chromium --remote-debugging-port=9222
2. Open several pages there.
3. Navigate to the given port from your client browser instance (WebKit nightly will do) and it will list inspectable pages opened in the browser as web links.
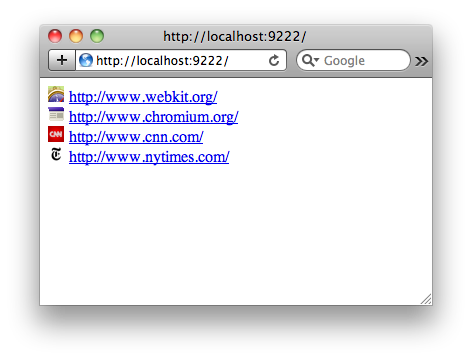
4. Follow any of these links to start remote debugging session for the corresponding page.
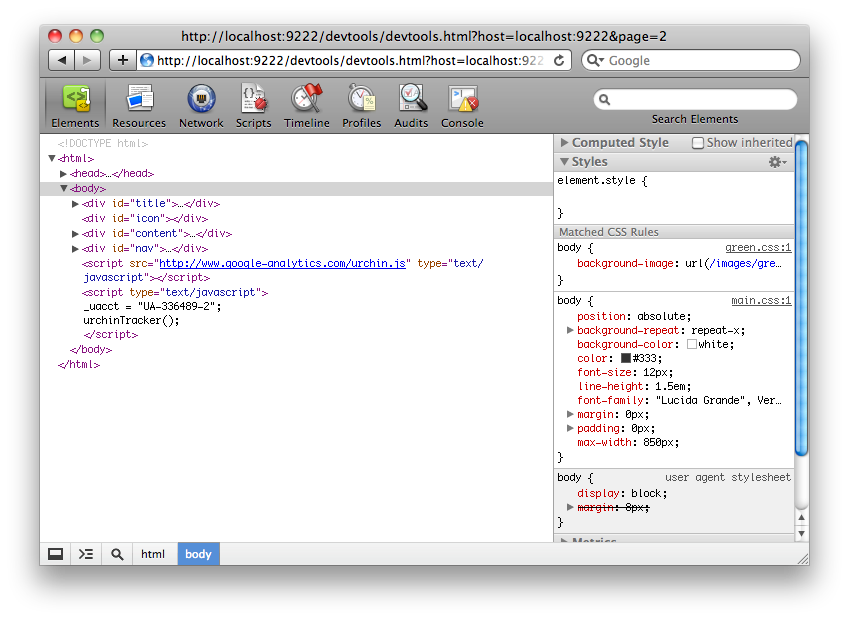
You will find remote debugging interface very similar to the Web Inspector and here is why:
- Target browser acts as a web server bound to the port 9222 on the localhost.
- Once you follow the link, your client browser fetches HTML, JavaScript and CSS files of the Web Inspector front-end over HTTP. Chromium serves as a web server in this case.
- Upon load event, Web Inspector establishes Web Socket connection back to the target browser and starts interchanging JSON messages with it.
In fact, pretty much the same scenario takes place within any WebKit-based browser when user opens Web Inspector. The only difference is that the transports being used for the JSON message interchange may vary. Note, that in case of mobile devices, front-end files can also be served from the cloud.
Remote Debugging Protocol
Another scenario for remote debugging is IDE integration. Web IDEs would like to provide seamless debugging experience integrated into their environments to the end user. Exposing unified WebKit remote debugging protocol would allow them to use alternate front-ends for the WebKit debugging.
Under the hood, Web Inspector front-end is talking to the browser backend by means of the Remote Debugging Protocol. This protocol is based on the JSON-RPC 2.0 specification. It is bidirectional: clients send asynchronous requests to the server, server responds to these requests and/or generates notifications. Since API surface for general purpose web debugging is huge, we divided it into a number of domains. Each domain contains requests and notifications specific to some area. Here is the list of the domains supported so far:
- Console – defines methods and events for interaction with the JavaScript console.
- CSS – exposes low level CSS read / write operations.
- Debugger – exposes JavaScript debugging functions; allows setting and removing breakpoints, stepping through execution, exploring stack traces, etc.
- DOM – This domain exposes DOM read/write operations.
- DOM Debugger – allows setting breakpoints on particular DOM operations and events. JavaScript execution will stop on these operations as if there was a regular breakpoint set.
- Network – allows tracking network activities of the page; exposes information about HTTP and WebSocket requests and responses, their headers, bodies, raw timing, etc.
- Page – actions and events related to the inspected page.
- Runtime – exposes JavaScript runtime by means of remote evaluation and mirror objects.
- Timeline – provides its clients with instrumentation records that are generated during the page runtime.
You can find JSON schema defining the protocol here. For your convenience, we generated documentation from this schema and published it on the Chrome DevTools page. Note that there are few unlisted domains such as Application Cache, DOM Storage, and Database, but they are not ready for the prime time yet.
What’s next
We are now open to the feedback on the WebKit Remote Debugging Protocol. We will collect all the feedback in the form of the Web Inspector bug reports and the Chrome Developer Tools forum messages. We will then address initial feedback, polish the protocol a bit and publish its first draft with a specific version. Once we have the protocol defined, developers can come up with the alternate front-ends (IDEs and such) that will interact with the WebKit instrumentation running in various browsers. We also expect all the WebKit ports to expose WebSocket interfaces similar to explained above or to come up with any other transport and bridge it with the Web Inspector front-end. Stay tuned!
May 9th, 2011 at 9:52 am
My understanding is that the remote debug capability is currently available for the RIM Playbook device as well. Can’t wait for this to be available for Android and iOS as well.
And until it is available on other platforms, a subset of Web Inspector capabilities is available with the weinre tool. weinre currently works on many modern mobile platforms that use WebKit as their web rendering engine. For more information, see http://pmuellr.github.com/weinre/
weinre leverages as much of the existing Web Inspector code and architecture as it can. It’s been great to have a nice architecture to work with. Kudos to the Web Inspector team!
May 9th, 2011 at 10:11 am
This is an awesome feature and an elegant solution to the troubles of debugging on mobile clients, kudos to the team!
One question I have though is what mobile clients out there support launching with the –remote-debugging-port flag set, and how does one go about setting that flag for them at launch time?
May 11th, 2011 at 11:10 am
This seems super useful. Although it seems like the one place I’d need this (iOS) there’s no way to start webkit with the remote-debugging flag turned on… Is there any way to use this on the iPad? Or if not, are there plans to update soon so Safari will start with this flag on?
May 16th, 2011 at 10:14 am
This will be so useful for mobile dev, hopefully this will be enabled in iOS when you turn on the debug console under settings:
Settings > Safari > Developer > Debug Console
Is there a roadmap for when this will be rolled out to various popular mobile WebKit browsers?