目录
Feature Crosses
A feature cross is a synthetic feature formed by multiplying (crossing) two or more features. Crossing combinations of features can provide predictive abilities beyond what those features can provide individually.
Learning Objectives
- Build an understanding of feature crosses.
- Implement feature crosses in TensorFlow.
Encoding Nonlinearity
In Figures 1 and 2, imagine the following:
- The blue dots represent sick trees.
- The orange dots represent healthy trees.
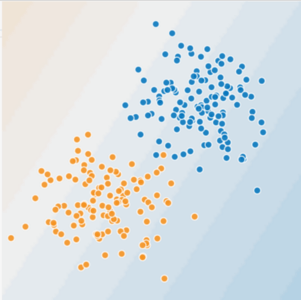
Figure 1. Is this a linear problem?
Can you draw a line that neatly separates the sick trees from the healthy trees? Sure. This is a linear problem. The line won't be perfect. A sick tree or two might be on the "healthy" side, but your line will be a good predictor.
Now look at the following figure:
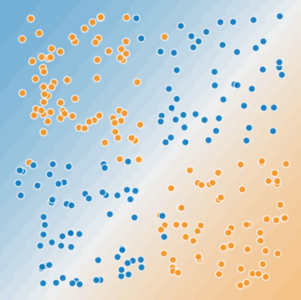
Figure 2. Is this a linear problem?
Can you draw a single straight line that neatly separates the sick trees from the healthy trees? No, you can't. This is a nonlinear problem. Any line you draw will be a poor predictor of tree health.
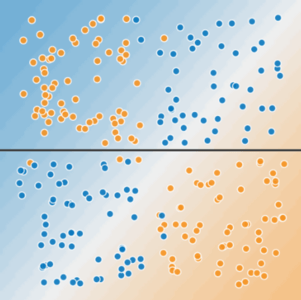
Figure 3. A single line can't separate the two classes.
To solve the nonlinear problem shown in Figure 2, create a feature cross.
A feature cross is a synthetic feature that encodes nonlinearity in the feature space by multiplying two or more input features together. (The term cross comes from cross product.) Let's create a feature cross named x3 by crossing x1 and x2:
x3=x1x2
We treat this newly minted x3 feature cross just like any other feature. The linear formula becomes:
y=b+w1x1+w2x2+w3x3
A linear algorithm can learn a weight for w3 just as it would for w1 and w2. In other words, although w3 encodes nonlinear information, you don’t need to change how the linear model trains to determine the value of w3.
Kinds of feature crosses
We can create many different kinds of feature crosses. For example:
[A X B]: a feature cross formed by multiplying the values of two features.[A x B x C x D x E]: a feature cross formed by multiplying the values of five features.[A x A]: a feature cross formed by squaring a single feature.
Thanks to stochastic gradient descent, linear models can be trained efficiently. Consequently, supplementing scaled linear models with feature crosses has traditionally been an efficient way to train on massive-scale data sets.
Glossay
1.synthetic feature:
A feature not present among the input features, but created from one or more of them. Kinds of synthetic features include:
1.Bucketing a continuous feature into range bins.
2.Multiplying (or dividing) one feature value by other feature value(s) or by itself.
3.Creating a feature cross.
Features created by normalizing or scaling alone are not considered synthetic features.2.feature cross:
A synthetic feature formed by crossing (taking a Cartesian product笛卡尔积 of) individual binary features obtained from categorical data or from continuous features via bucketing.
Feature crosses help represent nonlinear relationships.
Crossing One-Hot Vectors
So far, we've focused on feature-crossing two individual floating-point features. In practice, machine learning models seldom cross continuous features. However, machine learning models do frequently cross one-hot feature vectors. Think of feature crosses of one-hot feature vectors as logical conjunctions.
For example, suppose we have two features: country and language. A one-hot encoding of each generates vectors with binary features that can be interpreted as country=USA, country=France or language=English, language=Spanish. Then, if you do a feature cross of these one-hot encodings, you get binary features that can be interpreted as logical conjunctions, such as:
country:usa AND language:spanish
As another example, suppose you bin latitude and longitude, producing separate one-hot five-element feature vectors. For instance, a given latitude and longitude could be represented as follows:
binned_latitude = [0, 0, 0, 1, 0] binned_longitude = [0, 1, 0, 0, 0]
Suppose you create a feature cross of these two feature vectors:
binned_latitude X binned_longitude
This feature cross is a 25-element one-hot vector (24 zeroes and 1 one). The single 1 in the cross identifies a particular conjunction of latitude and longitude. Your model can then learn particular associations about that conjunction.
Suppose we bin latitude and longitude much more coarsely粗, as follows:
binned_latitude(lat) = [ 0 < lat <= 10
10 < lat <= 20
20 < lat <= 30 ]
binned_longitude(lon) = [ 0 < lon <= 15
15 < lon <= 30 ]
Creating a feature cross of those coarse bins leads to synthetic feature having the following meanings:
binned_latitude_X_longitude(lat, lon) = [ 0 < lat <= 10 AND 0 < lon <= 15
0 < lat <= 10 AND 15 < lon <= 30
10 < lat <= 20 AND 0 < lon <= 15
10 < lat <= 20 AND 15 < lon <= 30
20 < lat <= 30 AND 0 < lon <= 15
20 < lat <= 30 AND 15 < lon <= 30 ]
Now suppose our model needs to predict how satisfied dog owners will be with dogs based on two features:
- Behavior type (barking, crying, snuggling, etc.)
- Time of day
If we build a feature cross from both these features:
[behavior type X time of day]
then we'll end up with vastly more predictive ability than either feature on its own.
For example, if a dog cries (happily) at 5:00 pm when the owner returns from work will likely be a great positive predictor of owner satisfaction. Crying (miserably, perhaps) at 3:00 am when the owner was sleeping soundly will likely be a strong negative predictor of owner satisfaction.
Linear learners scale well to massive data. Using feature crosses on massive data sets is one efficient strategy for learning highly complex models. Neural networks provide another strategy.
Playground Exercises
Introducing Feature Crosses
Can a feature cross truly enable a model to fit nonlinear data?
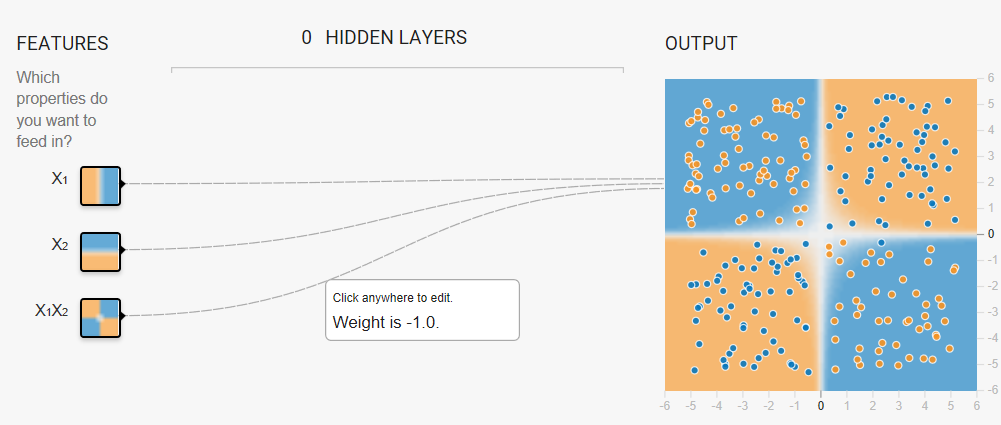
Task: Try to create a model that separates the blue dots from the orange dots by manually changing the weights of the following three input features:
- x1
- x2
- x1 x2 (a feature cross)
- w1 = 0
- w2 = 0
- x1 x2 = 1 (or any positive value)
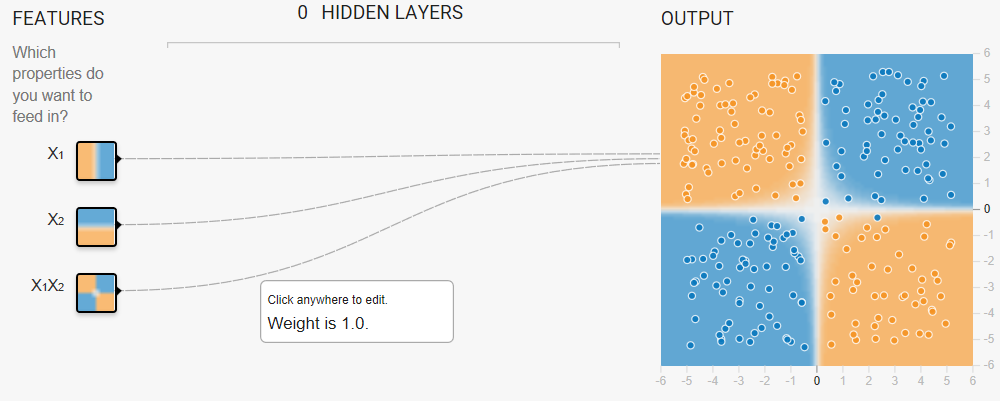
If you enter a negative value for the feature cross, the model will separate the blue dots from the orange dots but the predictions will be completely wrong. That is, the model will predict orange for the blue dots, and blue for the orange dots.
More Complex Feature Crosses
Now let's play with some advanced feature cross combinations. The data set in this Playground exercise looks a bit like a noisy bullseye from a game of darts飞镖游戏的噪音靶心, with the blue dots in the middle and the orange dots in an outer ring.
▾An explanation of model visualization.
Note the following about the model visualization:
- Each axis represents a specific feature.
In the case of spam vs. not spam, the features could be the word count and the number of recipients of the email.
Note: Appropriate axis values will depend on feature data. The axis values shown above would not make sense for word count or number of recipients, as neither can be negative.
- Each dot plots the feature values for one example of the data, such as an email.
- The color of the dot represents the class that the example belongs to.
For example, the blue dots can represent non-spam emails while the orange dots can represent spam emails.
- The background color represents the model's prediction of where examples of that color should be found.
A blue background around a blue dot means that the model is correctly predicting that example.
Conversely, an orange background around a blue dot means that the model is incorrectly predicting that example.
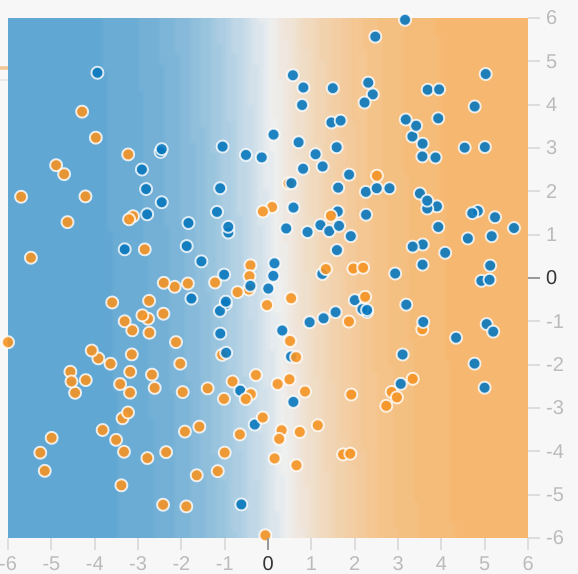
- The background blues and oranges are scaled.
For example, the left side of the visualization is solid blue but gradually fades to white in the center of the visualization.
You can think of the color strength as suggesting the model's confidence in its guess. So solid blue means that the model is very confident about its guess and light blue means that the model is less confident. (The model visualization shown in the figure is doing a poor job of prediction.)
Use the visualization to judge your model's progress. Beyond the colors, Playground also displays the model's current loss numerically.
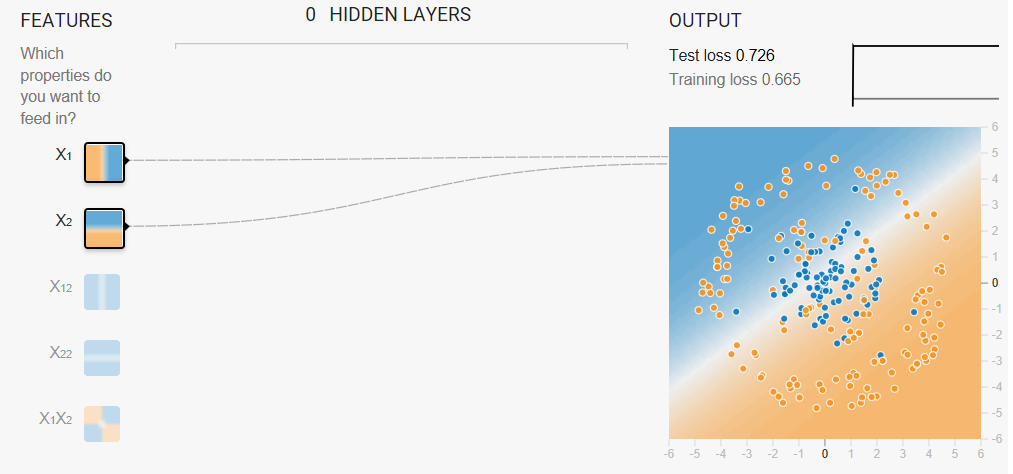
Task 1: Run this linear model as given. Spend a minute or two (but no longer) trying different learning rate settings to see if you can find any improvements. Can a linear model produce effective results for this data set?
No. A linear model cannot effectively model this data set. Reducing the learning rate reduces loss, but loss still converges收敛 at an unacceptably high value.
Task 2: Now try adding in cross-product features, such as x1x2, trying to optimize performance.
- Which features help most?
- What is the best performance that you can get?
Playground's data sets are randomly generated. Consequently, our answers may not always agree exactly with yours. In fact, if you regenerate the data set between runs, your own results won't always agree exactly with your previous runs. That said, you'll get better results by doing the following:
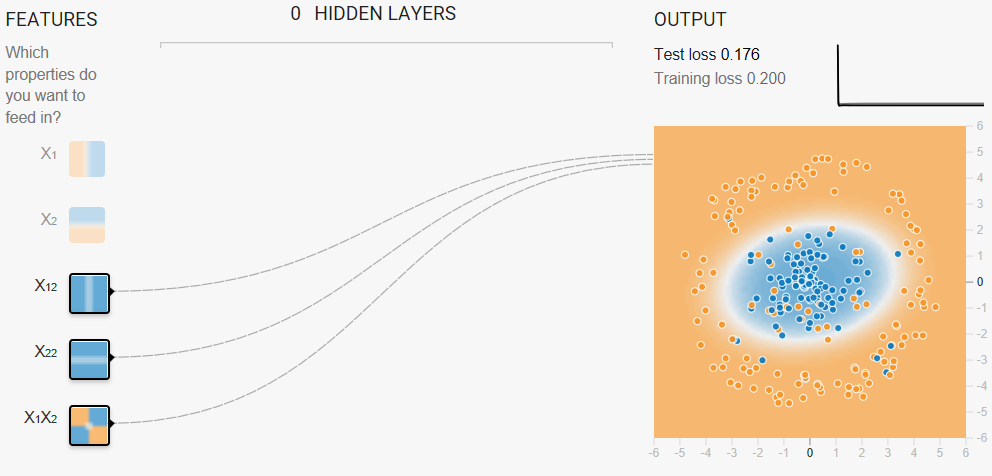
- Using both x12 and x22 as feature crosses. (Adding x1x2 as a feature cross doesn't appear to help.)
- Reducing the Learning rate, perhaps to 0.001.
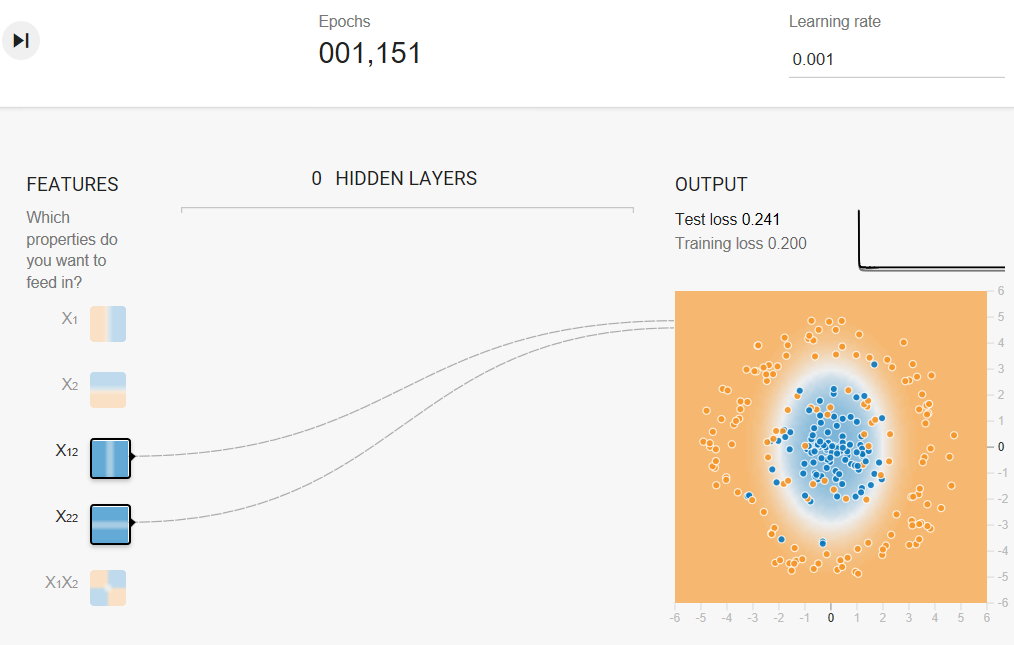
Task 3: When you have a good model, examine the model output surface (shown by the background color).
- Does it look like a linear model?
- How would you describe the model?
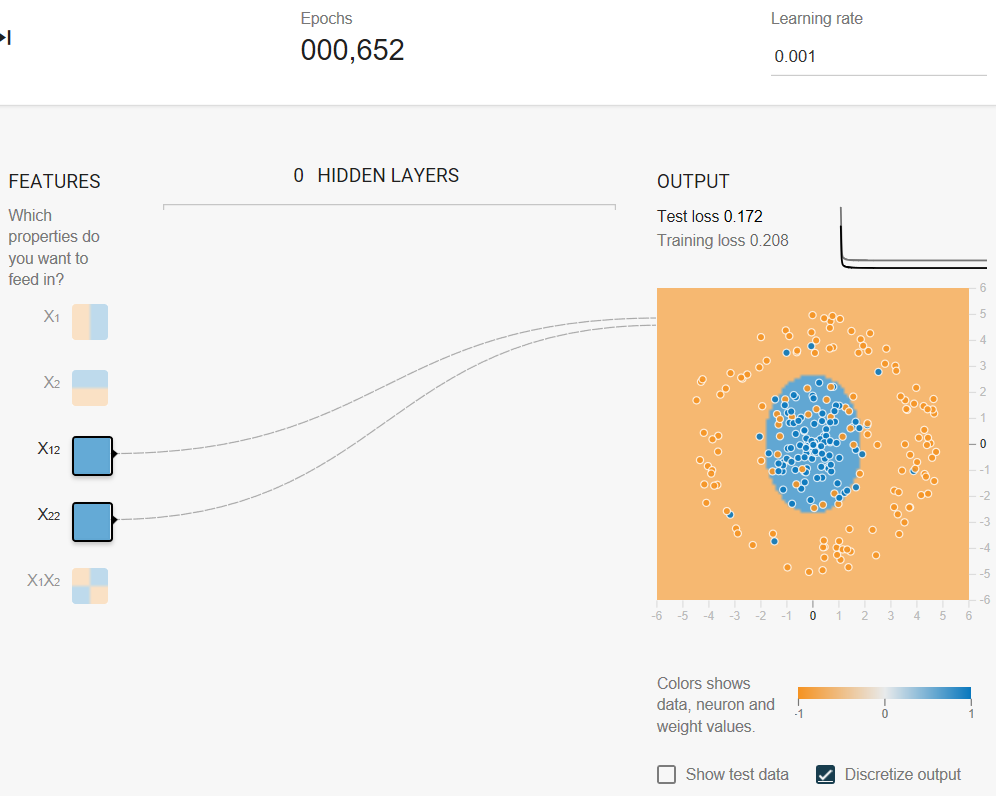
(Discretize output)
The model output surface does not look like a linear model. Rather, it looks elliptical.
Programming Exercise
In the following exercise, you'll explore feature crosses in TensorFlow:
Check Your Understanding
Different cities in California have markedly different housing prices. Suppose you must create a model to predict housing prices. Which of the following sets of features or feature crosses could learn city-specific relationships between roomsPerPerson and housing price?
One feature cross: [binned latitude X binned longitude X binned roomsPerPerson]
Crossing binned latitude with binned longitude enables the model to learn city-specific effects of roomsPerPerson. Binning prevents a change in latitude producing the same result as a change in longitude. Depending on the granularity of the bins, this feature cross could learn city-specific or neighborhood-specific or even block-specific effects.
Correct answer.
Two feature crosses: [binned latitude X binned roomsPerPerson] and [binned longitude X binned roomsPerPerson]
Binning is a good idea; however, a city is the conjunction of latitude and longitude, so separate feature crosses prevent the model from learning city-specific prices.
Try again.
One feature cross: [latitude X longitude X roomsPerPerson]
In this example, crossing real-valued features is not a good idea.不建议组合实值特征。 Crossing the real value of, say, latitude with roomsPerPerson enables a 10% change in one feature (say, latitude) to be equivalent to a 10% change in the other feature (say, roomsPerPerson).将纬度的实值与 roomsPerPerson 组合后,一个特征(比如纬度)上发生 10% 的变化就相当于另一个特征(比如 roomsPerPerson)上发生 10% 的变化。
Try again.
Three separate binned features: [binned latitude], [binned longitude], [binned roomsPerPerson]
Binning is good because it enables the model to learn nonlinear relationships within a single feature.这样可以让模型了解单个特征内的非线性关系. However, a city exists in more than one dimension, so learning city-specific relationships requires crossing latitude and longitude.
Try again.