zoukankan      html  css  js  c++  java
  • echart初体验

    Echarts  数据可视化  可以玩一玩  实用!

    Echarts主要的内容在于配置option.
    官网链接:http://echarts.baidu.com/index.html
    github:https://github.com/ecomfe/echarts
    文档页:http://echarts.baidu.com/option.html

    Echarts在github开源项目上的第一句话是:
    ECharts is a free, powerful charting and visualization library offering an easy way of adding intuitive, interactive, and highly customizable charts to your commercial products. It is written in pure JavaScript and based on zrender, which is a whole new lightweight canvas library.
    大致翻译:
    ECharts是一个免费的,功能强大的制图和可视化库。提供一个简单的方法来实现添加直观的,互动的,和高度可定制的图表,或者也可以是你的商业产品。它是用纯JavaScript和基于zrender(H5 canvas类库),一个全新的轻巧canvas库。

    浅谈Echarts3.0

     Vue+Echarts


    附上代码:

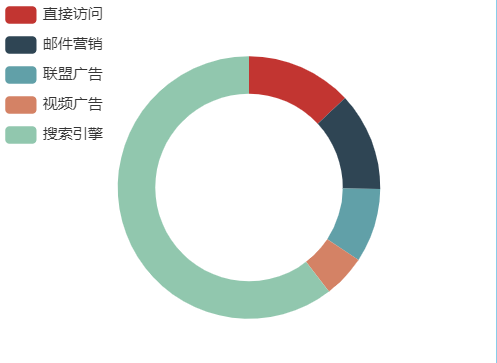
    <template>
      <!--为echarts准备一个具备大小的容器dom-->
      <div id="main" style=" 600px;height: 400px;"></div>
    </template>
    <script>
      import echarts from 'echarts'
        export default {
            name: '',
            data () {
                return {
                    charts: '',
                    opinion:['直接访问','邮件营销','联盟广告','视频广告','搜索引擎'],
                    opinionData:[
                      {value:335, name:'直接访问'},
                      {value:310, name:'邮件营销'},
                      {value:234, name:'联盟广告'},
                      {value:135, name:'视频广告'},
                      {value:1548, name:'搜索引擎'}
                    ]
                }
            },
            methods:{
                drawPie(id){
                   this.charts = echarts.init(document.getElementById(id))
                   this.charts.setOption({
                     tooltip: {
                       trigger: 'item',
                       formatter: '{a}<br/>{b}:{c} ({d}%)'
                     },
                     legend: {
                       orient: 'vertical',
                       x: 'left',
                       data:this.opinion
                     },
                     series: [
                       {
                         name:'访问来源',
                         type:'pie',
                         radius:['50%','70%'],
                         avoidLabelOverlap: false,
                         label: {
                           normal: {
                             show: false,
                             position: 'center'
                           },
                           emphasis: {
                             show: true,
                             textStyle: {
                               fontSize: '30',
                               fontWeight: 'blod'
                             }
                           }
                         },
                         labelLine: {
                           normal: {
                             show: false
                           }
                         },
                         data:this.opinionData
                       }
                     ]
                   })
                }
            },
          //调用
            mounted(){
                this.$nextTick(function() {
                    this.drawPie('main')
                })
            }
        }
    </script>
    <style scoped>
        * {
            margin: 0;
            padding: 0;
            list-style: none;
        }
    </style>
    View Code

    这是其中一个vue组件

    1.安装 echarts 安装包

    npm install echarts --save

    2.引入依赖

    import echarts from 'echarts'


    3.准备echarts容器

    <div id="main" style=" 600px;height: 400px;"></div>

    4.数据和 charts 变量可以描述在 data 中

    5.methods 中 定义一个方法,内容就是平时echarts的步骤。

    6.mounted 中调用 (mounted 是 vue 的生命周期,表示挂载完毕,html 已经渲染)

    mounted(){
                this.$nextTick(function() {
                    this.drawPie('main')
                })
            }

    效果:


    希望对您帮助!随意转载!
    转载自:https://blog.csdn.net/docallen/java/article/details/69324279

  • 相关阅读:
    sql server 交集,差集的用法 (集合运算)
    sql server join ,inner join ,left join ,right join 的使用
    SQL Server 中截取字符串常用的函数
    JS&Jquery中的循环/遍历
    Jquery一些实用函数
    jQuery扩展函数设置所有对象只读
    JQuery处理DOM元素-属性操作
    判断iframe页面是否加载完成
    给表增加主键,先判断表是否存在主键
    Jquery对select下拉框的操作
  • 原文地址:https://www.cnblogs.com/lin137/p/13391502.html
Copyright © 2011-2022 走看看