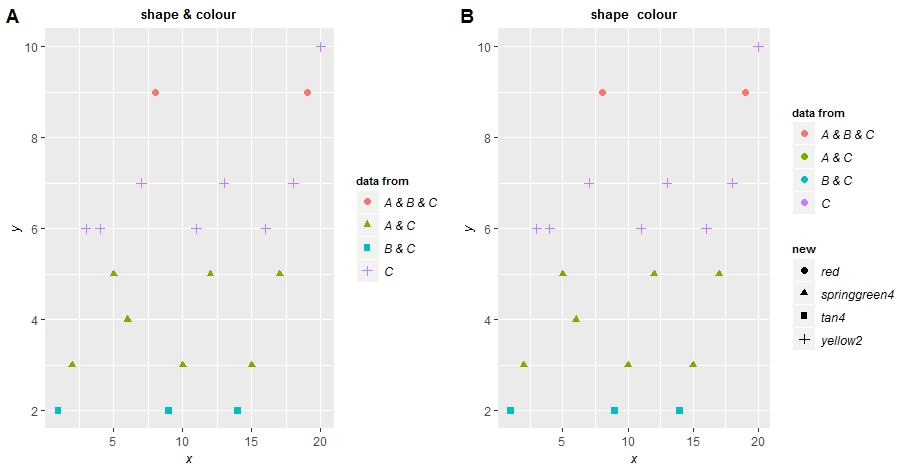
目的:数据的散点图中来自于不同数据集的点分别不同标记
library(dplyr)
library(ggplot2)
a<-c(2,3,6,6,5,4,7,9,2,3,6,5,7,2,3,6,5,7,9,10)
B = c(1:5)
C = c(1,2,6,7,8,10,12)


id <- seq(length(a))
b <- data.frame(id,a)

co = seq(length(a))
for(i in 1:length(a)){
  if((a[i] %in% B)==TRUE & (a[i] %in% C ==TRUE)){
    co[i] = 'tan4'
  }else if((a[i] %in% B)==FALSE & (a[i] %in% C ==TRUE)){
    co[i] = 'yellow2'
  }else if((a[i] %in% B)==TRUE & (a[i] %in% C ==FALSE)){
    co[i] = 'springgreen4'
  }else{
    co[i] = 'red'
  }
}


# 以下是两种作图方式,需要注意
# shape 与 colour 放到一起的方式

b <- mutate(b,new = co)
p <- ggplot(b,aes(x=id,y=a,color=new,shape = new))+geom_point(size=2)
p1 <- p +
  ggtitle(label ="shape & colour")+
  theme(plot.title = element_text(lineheight=.8, size=10, face="bold",hjust = 0.5)) +
  theme(legend.title=element_text(face="bold",size=8)) +
  theme(legend.text=element_text(face="italic",size=9))+
  xlab("x") + ylab("y") +
  theme(axis.title.x =element_text(face="italic",size=10), axis.title.y=element_text(face="italic",size=10))+
  scale_colour_discrete("data from",breaks=c("red", "springgreen4", "tan4","yellow2"),
                        labels=c("A & B & C","A & C","B & C","C"))+
  scale_shape_discrete("data from",breaks=c("red", "springgreen4", "tan4","yellow2"),
                       labels=c("A & B & C","A & C","B & C","C"))
p1


# shape 与 colour 单独分开的场景
b <- mutate(b,new = co)
p <- ggplot(b,aes(x=id,y=a,color=new,shape = new))+geom_point(size=2)
p2 <- p +
  ggtitle(label ="shape  colour")+
  theme(plot.title = element_text(lineheight=.8, size=10, face="bold",hjust = 0.5)) +
  theme(legend.title=element_text(face="bold",size=8)) +
  theme(legend.text=element_text(face="italic",size=9))+
  xlab("x") + ylab("y") +
  theme(axis.title.x =element_text(face="italic",size=10), axis.title.y=element_text(face="italic",size=10))+
  scale_colour_discrete("data from",breaks=c("red", "springgreen4", "tan4","yellow2"),
                   labels=c("A & B & C","A & C","B & C","C"))
p2


library(ggpubr)
ggarrange(p1,p2,ncol=2,nrow=1,labels=c("A","B"))