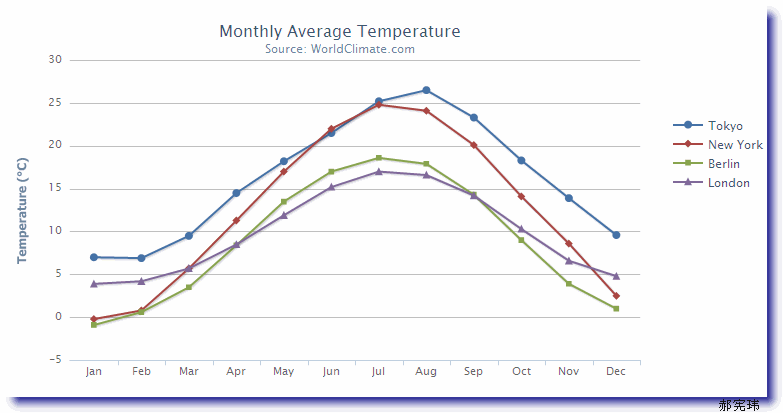
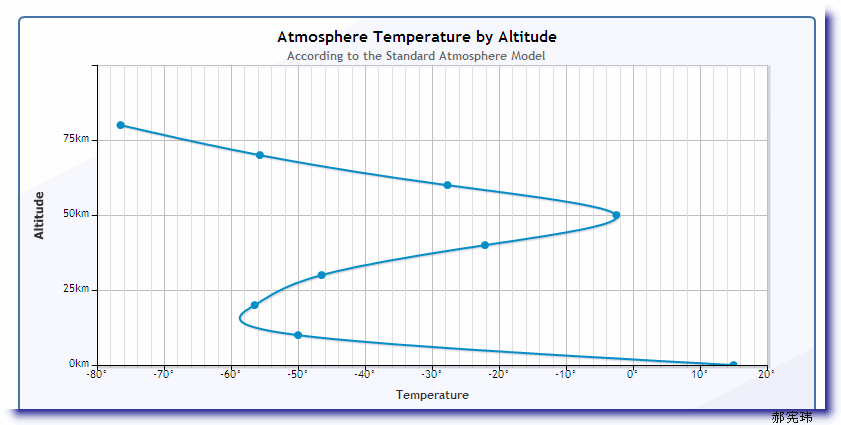
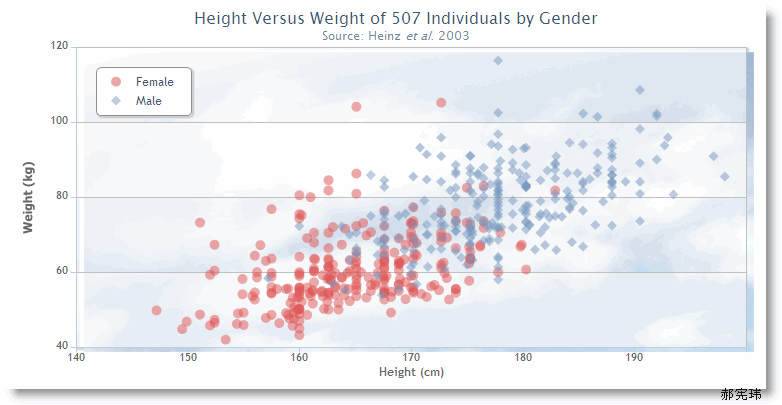
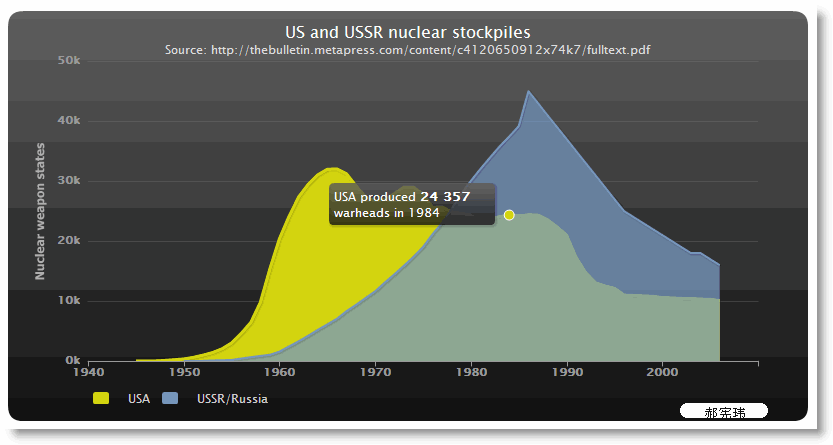
最近写了一个关于图表显示比例的东东,下面来分享一下:
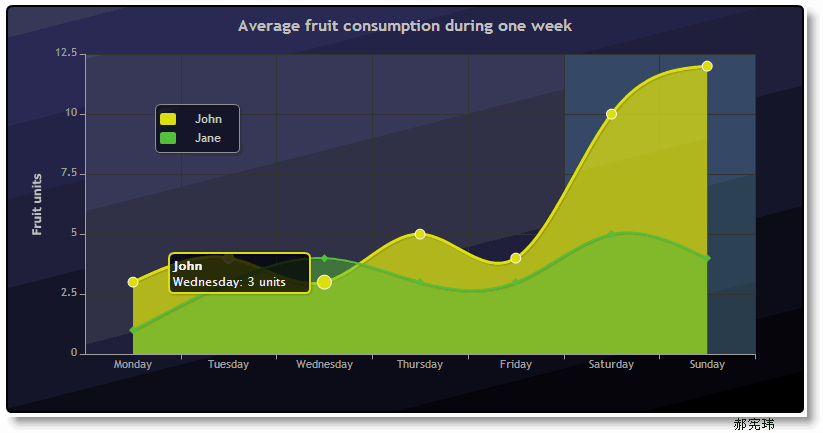
1、直线图
2、曲线图
3、散状图
4、区域图
5、区域曲线图
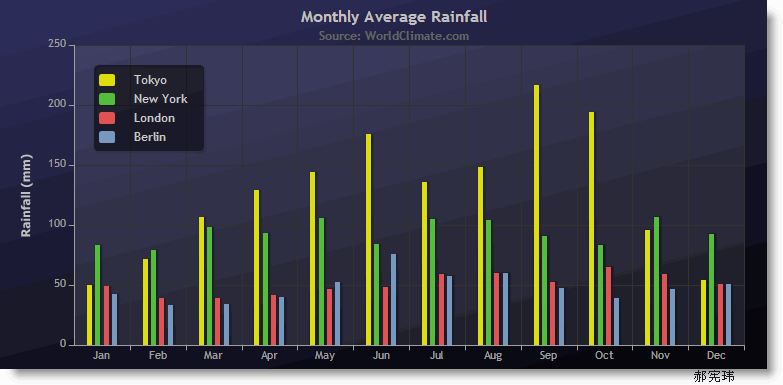
6、柱状图
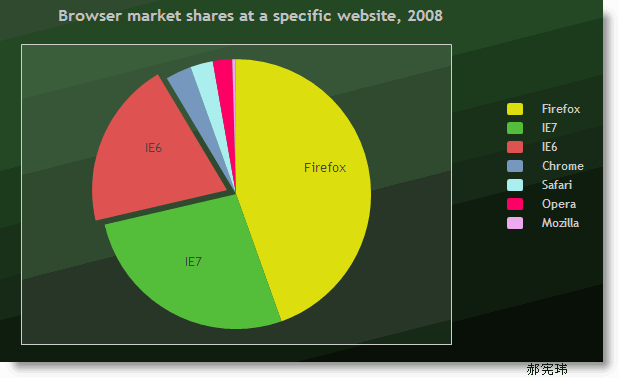
7、饼状图
下载highcharts插件地址http://www.highcharts.com
highcharts是不款非常不错的图表插件,有矩形图,饼图,条形条等几十种样式,下面来说一下它的使用,拿饼图来举例说一下:
首先要引用: <script srcjquery-1.4.1.min.js" type="text/javascript"></script>
<script src="http://www.cnblogs.com/js/highcharts.js"></script>
<script src="http://www.cnblogs.com/js/modules/exporting.js"></script>
然后再页面中加入一个div来放置饼图的
<div id="container" style="min- 400px; height: 400px; margin: 0 auto"></div>
<script type="text/javascript">
$(function () {
var chart;
$(document).ready(function() {
chart = new Highcharts.Chart({
chart: {
renderTo: 'container',
plotBackgroundColor: null,
plotBorderWidth: null,
plotShadow: false
},
title: {
text: 'Browser market shares at a specific website, 2010'
},
tooltip: {
formatter: function() {
return '<b>'+ this.point.name +'</b>: '+ this.percentage +' %';
}
},
plotOptions: {
pie: {
allowPointSelect: true,
cursor: 'pointer',
dataLabels: {
enabled: true,
color: '#000000',
connectorColor: '#000000',
formatter: function() {
return '<b>'+ this.point.name +'</b>: '+ this.percentage +' %';
}
}
}
},
series: [{
type: 'pie',
name: 'Browser share',
data: [
['Firefox', 45.0],
['IE', 26.8],
['Safari', 8.5],
['Opera', 6.2],
['Others', 0.7],
{
name: 'Chrome',
y: 12.8,
sliced: true,
selected: true
}
]
}]
});
});
});
</script>
那么一个饼图就出现了
name: '标题 ',
type: 'pie',
data: <%=strA %> //这里的strA是后台申请 的一个变量,里面的是按其规定的格式拼接起来的
}]
function twoDecimal(x) {
var f_x = parseFloat(x);
if (isNaN(f_x)) {
alert('错误的参数');
return false;
}
var f_x = Math.round(x * 100) / 100;
var s_x = f_x.toString();
var pos_decimal = s_x.indexOf('.');
if (pos_decimal < 0) {
pos_decimal = s_x.length;
s_x += '.';
}
while (s_x.length <= pos_decimal + 2) {
s_x += '0';
}
return s_x;
}
return '<b>'+ this.point.name +'</b>: '+twoDecimal( this.percentage )+' %';
}
