zoukankan      html  css  js  c++  java
  • echarts 数据区域可放大缩小层叠渐变折线图,柱状图

    层叠渐变折线图,层叠柱状图,数据区域可放大缩小


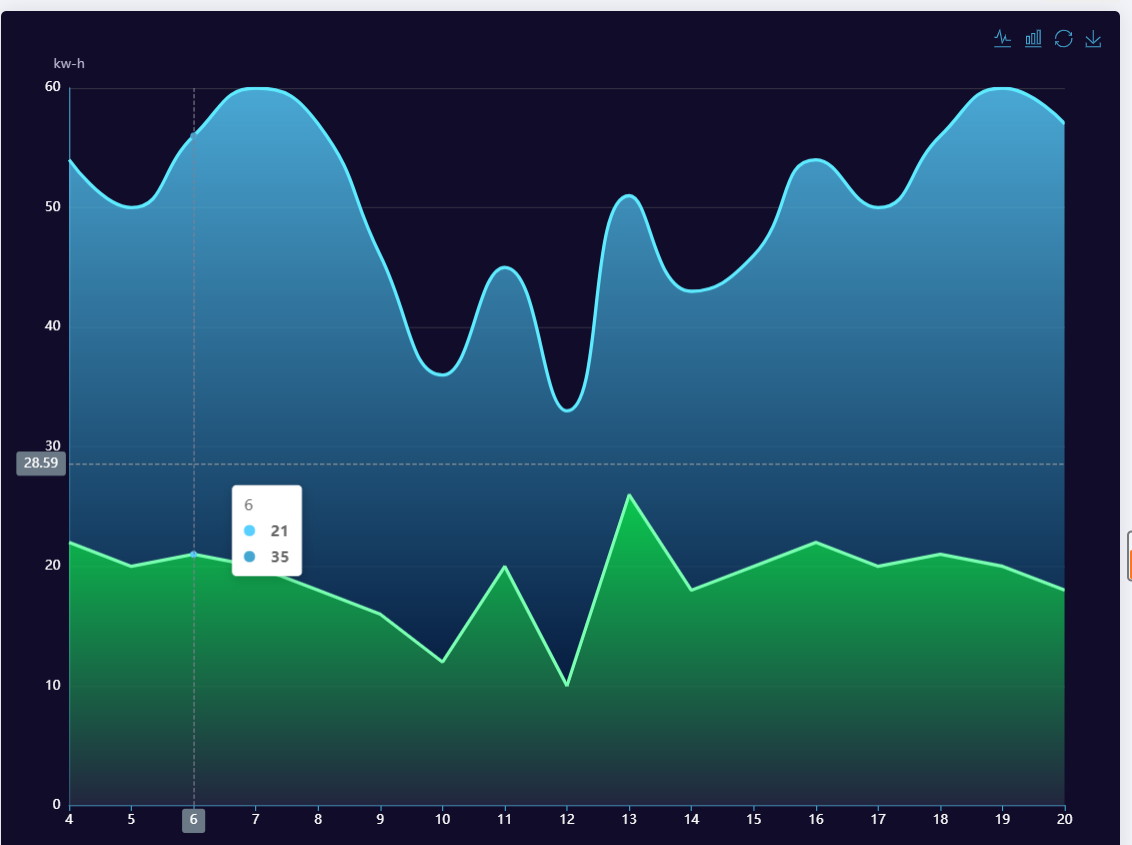
     const colors = ['#58CFFF', '#45A6D2', '#ffff', '#56D6ED', '#032044'];
    option = {
    color: colors,
                    title: {
                        // text: '能耗监测数据趋势图',
                        textStyle: {
                            color: colors[0], //标题颜色
                        },
                    },
                    tooltip: {
                        trigger: 'axis',
                        axisPointer: {
                            type: 'cross',
                            label: {
                                backgroundColor: '#6a7985',
                            },
                        },
                    },
                    legend: {
                        data: ['Line 1'],
                    },
                    toolbox: {
                        feature: {
                                                magicType: {
                                show: true,
                                type: ['line', 'bar']
                            },
                            restore: {
                                show: true
                            },
                            saveAsImage: {
                                show: true
                            },
                        },
                        iconStyle: {
                            borderColor: colors[1], //右上角toolbox图标颜色
                        }
                    },
                    grid: {
                        left: '3%',
                        right: '4%',
                        bottom: '3%',
                        containLabel: true,//做标轴边距
                    },
                    xAxis: [{
                        type: 'category',
                        boundaryGap: false,//数据与做标轴是否有间距
                        data: [    
                            '1',
                            '2',
                            '3',
                            '4',
                            '5',
                            '6',
                             '7',
                            '8',
                            '9',
                            '10',
                            '11',
                            '12',
                             '13',
                            '14',
                            '15',
                            '16',
                            '17',
                            '18',
                             '19',
                            '20',
                            '21',
                            '22',
                            '23',
                            '24',
                          ],
                        axisLabel: {
                            show: true,//x轴是否显示
                            textStyle: {
                                color: colors[2],
                            },
                        },
                        axisLine: {
                            show: true,
                            lineStyle: {
                                color: colors[1],
                                type: 'solid',
                                 1,
                            },
                        },
                    }, ],
                    yAxis: [{
                        name: 'kw-h',
                        type: 'value',
                        axisLine: {
                            show: true,
                            lineStyle: {
                                color: colors[1],
                                type: 'solid',
                                 1,
                            },
                        },
                        //设置网格线颜色
                        splitLine: {
                            show: true,//网格线是否显示
                            lineStyle: {
                                color: ['#6666'],
                                 1,
                                type: 'solid',
                            },
                        },
                        axisLabel: {
                            show: true,//y轴是否显示
                            textStyle: {
                                color: colors[2],
                            },
                        },
                    }, ],
                    dataZoom: [{//slider表示有滑动块的,inside表示内置滑动的
                        type: 'inside',
                        
                    }, ],
                    series: [{
                        name: '',
                        type: 'line',
                        stack: '总量',
                        smooth: false,//折线是否平滑
                        lineStyle: {
                             2,
                            color: '#6FF0A2',
                        },
                        showSymbol: false,
                        areaStyle: {
                            opacity: 0.8,
                            color: new echarts.graphic.LinearGradient(0, 0, 0, 1, [{
                                offset: 0,
                                color:'#08F758',
                            }, {
                                offset: 1,
                                color: '#262C44',
                            }])
                        },
                        emphasis: {
                            focus: 'series',
                        },
                        data: [ 26,18,20,22,20,21,20,18,16,12,20,10,26,18,20,22,20,21,20,18,16,12,20,10],
                        showBackground: true, //true开启柱状图背景
                        backgroundStyle: {
                            color: 'rgba(180, 180, 180, 0.2)'
                        }
                    }, {
                        name: '',
                        type: 'line',
                        stack: '总量',
                        smooth: true,
                        lineStyle: {
                             2,
                            color: colors[3],
                        },
                        showSymbol: false,//是否显示折线上的圆点
                        areaStyle: {
                            opacity: 0.8,
                            color: new echarts.graphic.LinearGradient(0, 0, 0, 1, [{
                                offset: 0,
                                color: colors[0],
                            }, {
                                offset: 1,
                                color: colors[4],
                            }])
                        },
                        emphasis: {
                            focus: 'series',
                        },
                        data: [25,25,26,32,30,35,40,39,30,24,25,23,25,25,26,32,30,35,40,39,30,24,25,23,],
                        showBackground: true, //true开启柱状图背景
                        backgroundStyle: {
                            color: 'rgba(180, 180, 180, 0.2)'
                        }
                    }, ],
    };
  • 相关阅读:
    个人7天安排
    七天安排
    京东搜索规则
    关于从一个整数数组中求得最大的子整数组和
    结对项目开发--电梯调度
    分析英文文本各个词出现的频率
    关于安卓版的eclipse连接数据库并誓言增删改查
    电梯调度 结对开发项目
    求一个二维数组的最大子数组
    求一堆数组中最大的子数组
  • 原文地址:https://www.cnblogs.com/luckybaby519/p/15146603.html
Copyright © 2011-2022 走看看