zoukankan      html  css  js  c++  java
  • echarts 多条数据渐变缩放多状态折线图

    import * as echarts from 'echarts';
    
    var chartDom = document.getElementById('main');
    var myChart = echarts.init(chartDom, 'dark');
    var option;
    
    var colors = ['#58CFFF', '#08F758', '#713AB1', '#45A6D2', '#ffff', '#56D6ED', '#032044']
                 // const colors = ['#713AB1', '#45A6D2', '#ffff', '#56D6ED', '#032044']
                  option = {
                      color: colors,
                      title: {
                          // text: '能耗监测数据趋势图',
                          textStyle: {
                              color: colors[3], //标题颜色
                          },
                      },
                      tooltip: {
                          trigger: 'axis',
                          axisPointer: {
                              type: 'cross',
                              label: {
                                  backgroundColor: '#6a7985',
                              },
                          },
                      },
                      toolbox: {//右上角图示
                          show: true,
                          feature: {
                               dataView: {
                                   show: true,
                                   readOnly: false
                               },
                              magicType: {
                                  show: true,
                                  type: ['line', 'bar']
                              },
                              restore: {
                                  show: true
                              },
                               saveAsImage: {
                                   show: true
                               }
                          }
                      },
                      legend: {//图例
                          x: 'left', //x : 左(left)、右(right)、居中(center)
                          padding: [10, 0, 0, 20], //padding:[0,30,0,0] [(上),(右)、(下)、(左)]
                          textStyle: {
                              //图例文字的样式
                              color: '#fff',
                              fontSize: 12,
                          },
                          data: this.radioName,
                      },
    
                      grid: {
                          left: '3%',
                          right: '4%',
                          bottom: '3%',
                          containLabel: true,
                      },
                      xAxis: [{
                          type: 'category',
                          boundaryGap: false,
                          data: [
                                 '1',
                                 '2',
                                 '3',
                                 '4',
                                 '5',
                                 '6',
                                 '7',
                                 '8',
                                 '9',
                                 '10',
                                 '11',
                                 '12',
                                 '13',
                                 '14',
                                 '15',
                                 '16',
                                 '17',
                                 '18',
                                 '19',
                                 '20',
                                 '21',
                                 '22',
                                 '23',
                                 '24',
                             ],
                          axisLabel: {
                              show: true,
                              textStyle: {
                                  color: colors[4],
                                  fontSize: 10,
                              },
                          },
                          axisLine: {
                              show: true,
                              lineStyle: {
                                  color: colors[4],
                                  type: 'solid',
                                   1,
                              },
                          },
                      }, ],
                      yAxis: [{
                          name: '',
                          type: 'value',
                          axisLine: {
                              show: true,
                              lineStyle: {
                                  color: colors[4],
                                  type: 'solid',
                                   1,
                              },
                          },
                          //设置网格线颜色
                          splitLine: {
                              show: true,
                              lineStyle: {
                                  color: ['#6666'],
                                   1,
                                  type: 'solid',
                              },
                          },
                          axisLabel: {
                              show: true,
                              textStyle: {
                                  color: colors[4],
                              },
                          },
                      }, ],
                      dataZoom: [{
                          type: 'inside',
                      }, ],
                      series: [
    
                             {
                                   name: '土壤氮传感器',
                                   type: 'line',
                                   stack: '',
                                   smooth: true,
                                   lineStyle: {
                                        2,
                                       color: colors[1],
                                   },
                                   showSymbol: false,
                                   areaStyle: {
                                       opacity: 0.8,//透明度
                                       color: new echarts.graphic.LinearGradient(0, 0, 0, 1, [{
                                           offset: 0,//渐变色
                                           color: colors[1],
                                       }, {
                                           offset: 1,
                                           color: '#262C44',
                                       }])
                                   },
                                   emphasis: {
                                       focus: 'series',
                                   },
                                
                                      data: [26, 18, 20, 22, 20, 21, 21, 21, 21, 21, 20, 10, 26, 18, 20, 22, 20, 21, 20, 18, 16, 12, 20, 10],
                                   showBackground: true, //true开启柱状图背景
                                   backgroundStyle: {
                                       color: 'rgba(180, 180, 180, 0.2)'
                                   }
                               },
                             {
                                 name: '土壤磷传感器',
                                 type: 'line',
                                 stack: '',
                                 smooth: true,
                                 lineStyle: {
                                      2,
                                     color: colors[0],
                                 },
                                 showSymbol: false,
                                 areaStyle: {
                                     opacity: 0.8,
                                     color: new echarts.graphic.LinearGradient(0, 0, 0, 1, [{
                                         offset: 0,
                                         color: colors[0],
                                     }, {
                                         offset: 1,
                                         color: colors[6],
                                     }])
                                 },
                                 emphasis: {
                                     focus: 'series',
                                 },
                                 data: [25, 25, 26, 25, 26, 26, 20, 19, 20, 24, 25, 23, 24, 25, 26, 32, 30, 35, 34, 35, 30, 24, 25, 23, ],
                                 showBackground: true, //true开启柱状图背景
                                 backgroundStyle: {
                                     color: 'rgba(180, 180, 180, 0.2)'
                                 }
                             },
                           {
                               name: '土壤钾传感器',
                               type: 'line',
                               stack: '',
                               smooth: true,
                               lineStyle: {
                                    2,
                                   color: colors[2],
                               },
                               showSymbol: false,
                               areaStyle: {
                                   opacity: 0.8,
                                   color: new echarts.graphic.LinearGradient(0, 0, 0, 1, [{
                                       offset: 0,
                                       color: colors[2],
                                   }, {
                                       offset: 1,
                                       color: "#302E5D",
                                   }])
                               },
                               emphasis: {
                                   focus: 'series',
                               },
                               data: [20, 19, 18, 18, 17, 16, 15, 17, 18, 20, 21, 22, 23, 24, 25, 26, 27, 26, 25, 24, 23, 18, 17, 16, ],
                               showBackground: true, //true开启柱状图背景
                               backgroundStyle: {
                                   color: 'rgba(180, 180, 180, 0.2)'
                               }
                           },
                      ],
                  };
    
    option && myChart.setOption(option);

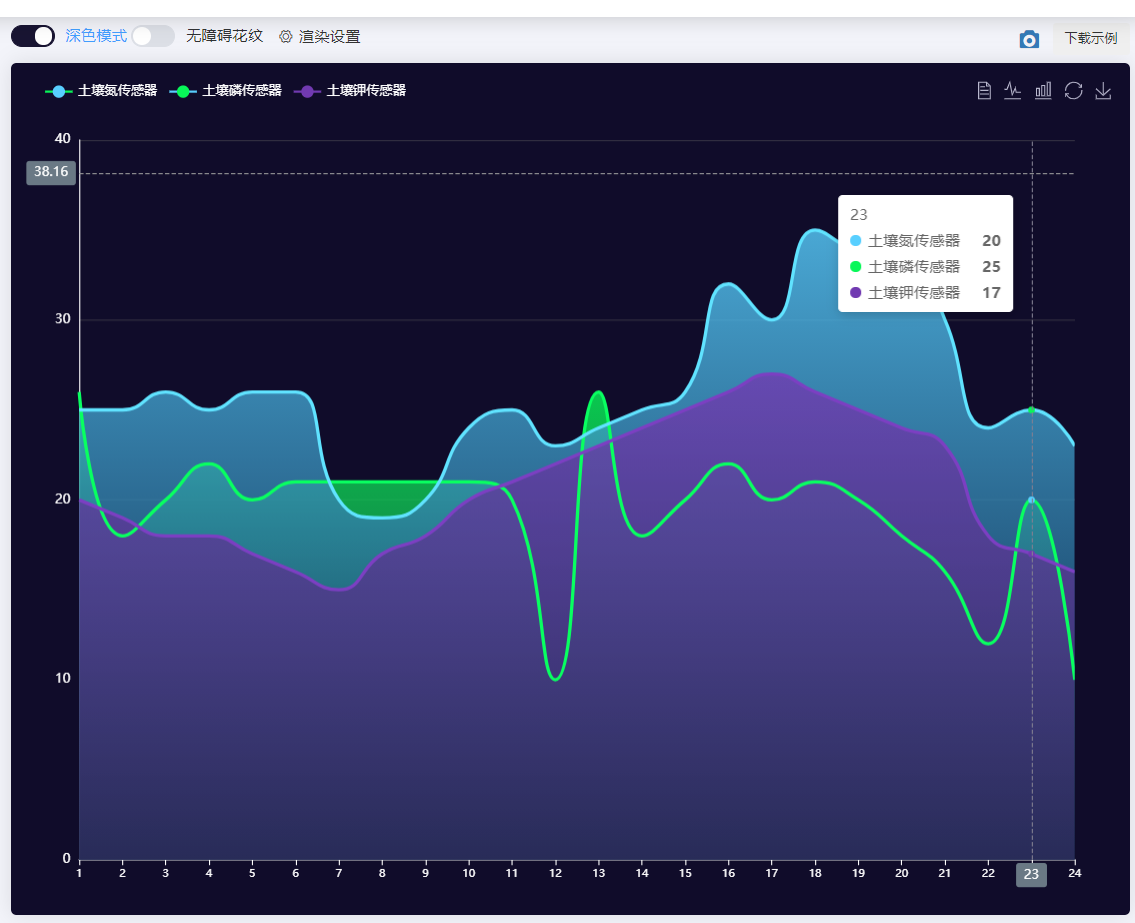
    效果如下图所示,如果要下载的话记得将白色(#fff)改变一下啊,如果不改变,下载出来的图片白色是看不见的
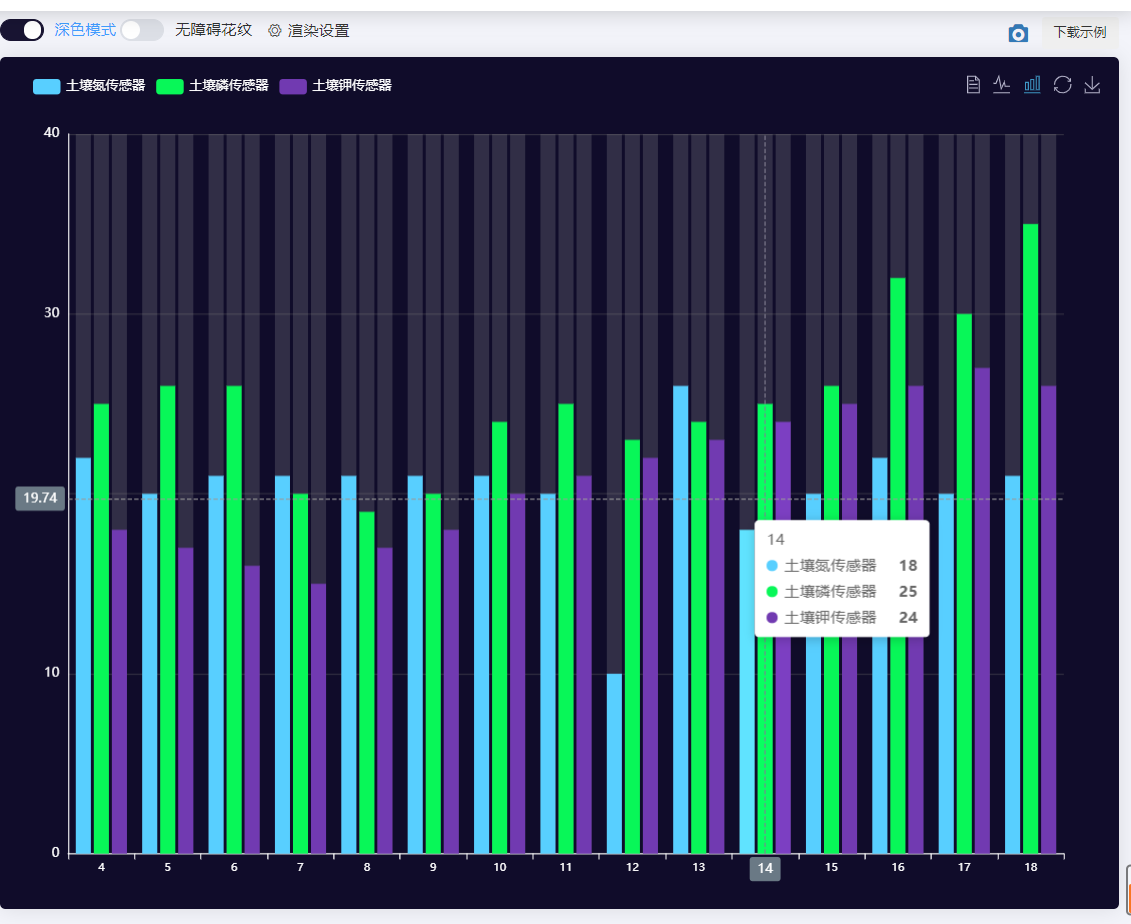
    点击右上角图标切换显示不同状态

  • 相关阅读:
    在Azure虚拟机上安装SQL server
    Azure的负载均衡机制
    如何在ARM中创建Express Route
    如何将已部署在ASM的资源迁移到ARM中
    Azure上的那些IP
    使用mysqlslap对mysql进行压测,观察Azure虚拟机cpu使用率
    在Azure虚拟机上安装VNC
    DataGridView中实现checkbox全选的自定义控件
    jquery checkbox 实现单选
    如何通过Azure Service Management REST API管理Azure服务
  • 原文地址:https://www.cnblogs.com/luckybaby519/p/15232763.html
Copyright © 2011-2022 走看看