在从generate_normal_entry()函数调用generate_fixed_frame()函数时的栈与寄存器的状态如下:
栈的状态如下图所示。
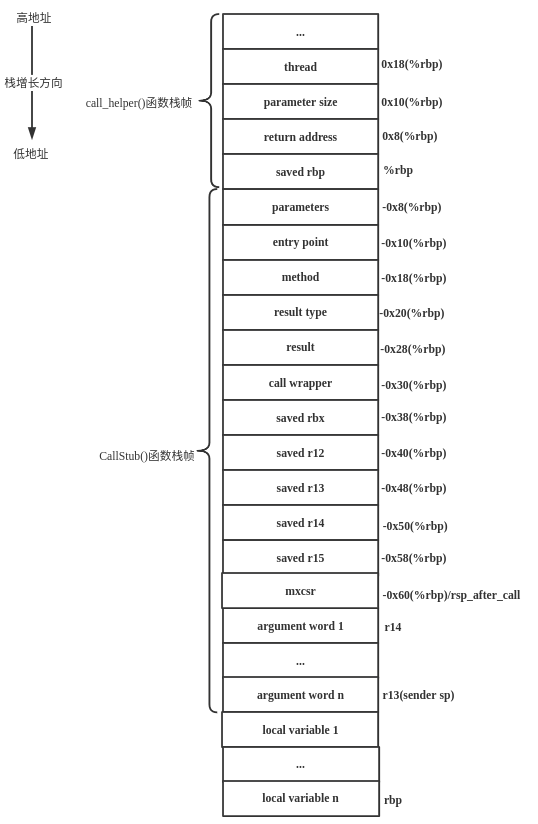
各个寄存器的状态如下所示。
rax: return address     // %rax寄存器中存储的是返回地址r
rbx: Method*            // 要执行的Java方法的指针
r14: pointer to locals  // 本地变量表指针
r13: sender sp          // 调用者的栈顶
调用的generate_fixed_frame()方法的实现如下:
源代码位置:src/cpu/x86/vm/templateInterpreter_x86_64.cpp

// Generate a fixed interpreter frame. This is identical setup for
// interpreted methods and for native methods hence the shared code.
void TemplateInterpreterGenerator::generate_fixed_frame(bool native_call) {
  // initialize fixed part of activation frame
  __ push(rax);             // save return address    把返回地址紧接着局部变量区保存
  __ enter();               // save old & set new rbp 进入固定桢
  __ push(r13);             // set sender sp          保存调用者的栈顶地址
  __ push((int)NULL_WORD);  // leave last_sp as null
  __ movptr(r13, Address(rbx, Method::const_offset()));      // 获取ConstMethod*并保存到r13中
  __ lea(r13, Address(r13, ConstMethod::codes_offset()));    // 保存字节码的地址到r13中
  __ push(rbx);             // 保存Method*的地址到堆栈上

  // ProfileInterpreter的默认值为true,表示需要对方法进行信息编译
  if (ProfileInterpreter) {
    Label method_data_continue;
    // MethodData结构基础是ProfileData,记录函数运行状态下的数据
    // MethodData里面分为3个部分,一个是函数类型等运行相关统计数据,一个是参数类型运行相关统计数据,
    // 还有一个是extra扩展区保存着deoptimization的相关信息
    // 获取Method中的_method_data属性的值并保存到rdx中
    __ movptr(rdx, Address(rbx, in_bytes(Method::method_data_offset())));
    __ testptr(rdx, rdx);
    __ jcc(Assembler::zero, method_data_continue);
    // 执行到这里,说明_method_data已经进行了初始化,通过MethodData来获取_data属性的值并存储到rdx中
    __ addptr(rdx, in_bytes(MethodData::data_offset()));
    __ bind(method_data_continue);
    __ push(rdx);      // set the mdp (method data pointer)
  } else {
    __ push(0);
  }

  __ movptr(rdx, Address(rbx, Method::const_offset()));          // 获取ConstMethod*存储到rdx
  __ movptr(rdx, Address(rdx, ConstMethod::constants_offset())); // 获取ConstantPool*存储到rdx
// 获取ConstantPoolCache*并存储到rdx
  __ movptr(rdx, Address(rdx, ConstantPool::cache_offset_in_bytes()));
  __ push(rdx); // 保存ConstantPoolCache*到堆栈上
  __ push(r14); // 保存第1个参数的地址到堆栈上

  if (native_call) {
    __ push(0); // no bcp
  } else {
    __ push(r13); // 保存Java方法字节码地址到堆栈上,注意上面对r13寄存器的值进行了更改
  }
  __ push(0); // reserve word for pointer to expression stack bottom
  __ movptr(Address(rsp, 0), rsp); // set expression stack bottom //在rsp的地址保存rsp的值
}
生成的汇编代码如下:
0x00007fffed01b254: push   %rax
0x00007fffed01b255: push   %rbp
0x00007fffed01b256: mov    %rsp,%rbp
0x00007fffed01b259: push   %r13
0x00007fffed01b25b: pushq  $0x0
0x00007fffed01b260: mov    0x10(%rbx),%r13
0x00007fffed01b264: lea    0x30(%r13),%r13 // lea指令获取内存地址本身
0x00007fffed01b268: push   %rbx
0x00007fffed01b269: mov    0x18(%rbx),%rdx
0x00007fffed01b26d: test   %rdx,%rdx
0x00007fffed01b270: je     0x00007fffed01b27d
0x00007fffed01b276: add    $0x90,%rdx
0x00007fffed01b27d: push   %rdx
0x00007fffed01b27e: mov    0x10(%rbx),%rdx
0x00007fffed01b282: mov    0x8(%rdx),%rdx
0x00007fffed01b286: mov    0x18(%rdx),%rdx
0x00007fffed01b28a: push   %rdx
0x00007fffed01b28b: push   %r14
0x00007fffed01b28d: push   %r13
0x00007fffed01b28f: pushq  $0x0
0x00007fffed01b294: mov    %rsp,(%rsp)
通过源代码结合汇编的方式可以将代码的逻辑看的清清楚楚,最终的栈状态变为了如下的样子:
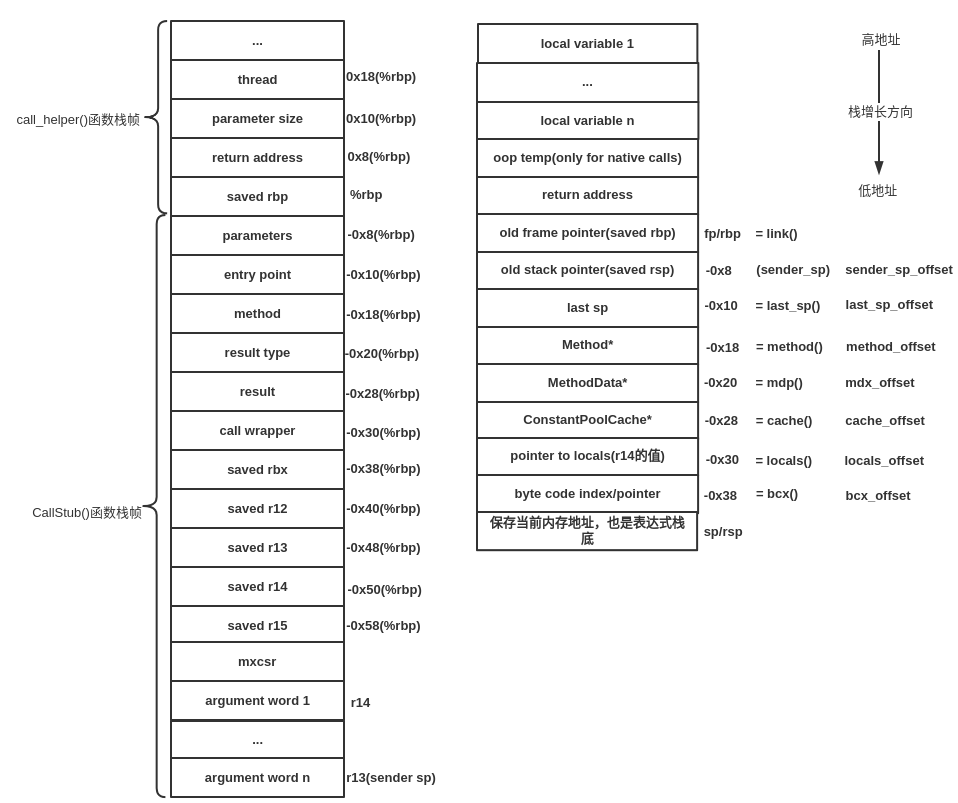
左边的栈底与右边的栈顶是连续的,右边的栈中除local variable1、...、local variable n之外都是调用generate_fixed_frame()生成的。而argument word 1、...、argument word n加上右边的栈布局就是调用Java方法的栈布局,也就是如下图所示。

可以看到,2个栈帧重用了argument word 1、...、argument word n,而浅灰色与深灰色加起来就是为调用Java方法分配的本地变量表。
相关文章的链接如下:
1、在Ubuntu 16.04上编译OpenJDK8的源代码
13、类加载器
14、类的双亲委派机制
15、核心类的预装载
16、Java主类的装载
17、触发类的装载
18、类文件介绍
19、文件流
20、解析Class文件
21、常量池解析(1)
22、常量池解析(2)
23、字段解析(1)
24、字段解析之伪共享(2)
25、字段解析(3)
28、方法解析
29、klassVtable与klassItable类的介绍
30、计算vtable的大小
31、计算itable的大小
32、解析Class文件之创建InstanceKlass对象
33、字段解析之字段注入
34、类的连接
35、类的连接之验证
36、类的连接之重写(1)
37、类的连接之重写(2)
38、方法的连接
39、初始化vtable
40、初始化itable
41、类的初始化
42、对象的创建
43、Java引用类型
50、CallStub栈帧
作者持续维护的个人博客 classloading.com。
关注公众号,有HotSpot源码剖析系列文章!
