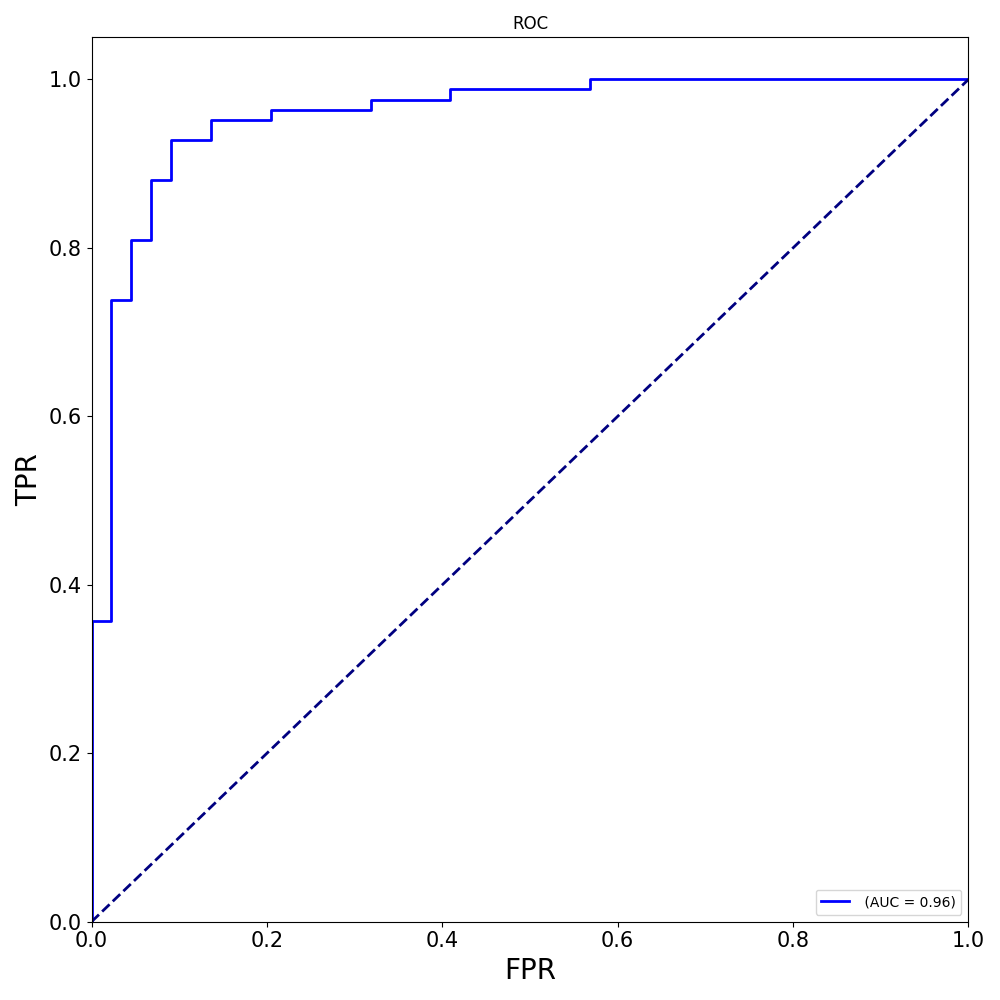
代码:
# -*- encoding: utf-8 -*-
import matplotlib.pyplot as plt

from sklearn.metrics import roc_curve, auc

y_score=[2.5710e-05,7.6021e-04,9.9500e-01,4.9876e-04,8.4120e-01,9.9985e-01,2.6030e-03,1.8916e-03,2.7966e-01,1.8275e-04,9.9862e-01,2.7307e-01,9.7251e-01,2.0718e-03,8.1815e-01,1.8753e-04,1.5538e-03,9.9445e-01,3.8135e-02,1.2139e-08,1.7349e-09,9.3771e-01,1.2849e-07,8.9182e-01,9.7422e-01,4.3771e-02,4.9922e-01,9.5356e-01,2.6138e-02,8.9550e-01,9.9974e-01,9.0011e-01,9.9655e-01,9.9761e-01,9.9976e-01,9.9834e-01,7.6716e-01,1.6783e-01,6.1992e-02,9.7692e-01,9.4144e-01,8.8730e-01,7.7039e-01,9.9995e-01,9.9765e-01,9.9300e-01,9.9860e-01,9.9991e-01,9.9910e-01,9.7648e-01,9.9999e-01,1.0615e-01,8.8166e-01,9.9841e-01,9.7193e-01,6.2299e-01,9.1223e-01,4.0745e-01,3.2023e-05,8.9772e-01,7.0481e-01,5.4204e-04,7.7293e-01,8.9764e-01,9.8755e-01,7.8579e-01,5.0246e-02,6.5462e-04,3.3914e-03,2.3855e-01,1.1269e-02,3.0656e-05,9.9288e-01,1.0808e-03,7.4250e-04,9.6706e-01,5.8778e-03,6.9300e-03,9.7524e-01,9.1143e-01,7.1098e-04,5.7355e-02,9.9965e-01,8.3521e-01,9.8651e-01,8.0235e-03,9.9997e-01,9.9974e-01,1.0841e-04,9.6148e-01,9.4887e-01,9.7578e-01,9.2913e-01,9.9993e-01,1.7583e-03,8.2347e-01,3.2468e-04,9.9991e-01,1.8695e-03,2.7214e-01,9.9969e-01,3.9096e-01,1.1035e-02,1.0111e-03,5.4798e-02,2.6224e-01,1.8990e-03,7.3666e-03,3.9698e-02,7.6674e-01,2.0682e-03,1.1370e-01,5.8183e-01,9.9999e-01,7.3920e-01,4.5544e-02,9.9713e-01,5.8665e-01,9.8919e-01,8.1856e-05,1.2386e-01,9.9940e-01,7.2090e-02,5.7341e-05,3.4181e-05,9.8991e-01,1.2511e-04,3.0404e-04]
y_test=[0,0,1,0,1,1,0,0,1,0,1,1,1,0,1,0,0,1,0,0,0,1,0,1,1,0,1,1,1,1,1,1,1,1,1,1,1,1,1,1,1,1,1,1,1,1,1,1,1,1,1,1,1,1,1,1,1,1,0,1,1,0,1,1,1,1,1,0,0,1,0,0,1,0,1,1,1,0,1,1,0,0,1,1,0,0,1,1,0,1,1,1,1,1,0,1,0,1,0,1,1,0,0,0,0,1,1,0,0,1,0,1,1,1,0,1,1,1,1,0,0,1,1,0,0,1,0,0]

fpr, tpr, threshold = roc_curve(y_test, y_score)

roc_auc = auc(fpr,tpr)
plt.figure(figsize=(10,10), facecolor=(1, 1, 1))
lw = 2
# darkorange
plt.plot(fpr, tpr, color='blue', lw=lw, label=' (AUC = %0.2f)' % roc_auc)
plt.plot([0, 1], [0, 1], color='navy', lw=lw, linestyle='--')
plt.xlim([0.0, 1.0])
plt.ylim([0.0, 1.05])
plt.xticks(fontsize=15)
plt.yticks(fontsize=15)
plt.xlabel('FPR', fontsize=20)
plt.ylabel('TPR', fontsize=20)
plt.title('ROC')
plt.legend(loc="lower right")
plt.show()
效果: