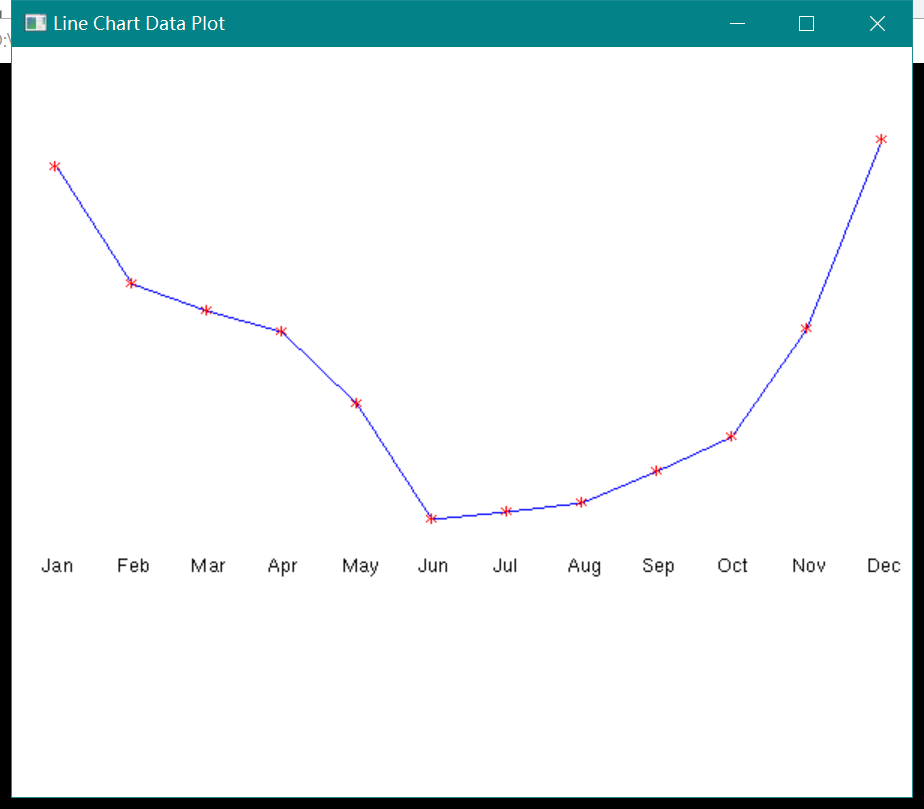
#include "stdafx.h"
#include<GL/glut.h>

/*Initial display-window size*/
GLsizei winWidth = 600, winHeight = 500;
/*Initialize raster position*/
GLint xRaster = 25, yRaster = 150;

GLubyte label[36] = { 'J','a','n','F','e','b','M','a','r',
'A','p','r','M','a','y','J','u','n',
'J','u','l','A','u','g','S','e','p',
'O','c','t','N','o','v','D','e','c'
};
GLint dataValue[12] = { 420,342,324,310,262,185,
190,196,217,240,312,438 };

void init(void)
{
    glClearColor(1.0, 1.0, 1.0, 1.0);//white display windows.
    glMatrixMode(GL_PROJECTION);
    gluOrtho2D(0.0, 600.0, 0.0, 500.0);
}
void lineGraph(void)
{
    GLint month, k;
    GLint x = 30;//Initialize x position for chart.

    glClear(GL_COLOR_BUFFER_BIT);//Clear display window.
    glColor3f(0.0, 0.0, 1.0);//Set line color to blue.
    glBegin(GL_LINE_STRIP);//PLot data as a polyline.
    for (k = 0; k < 12; k++)
        glVertex2i(x + k * 50, dataValue[k]);
    glEnd();

    glColor3f(1.0, 0.0, 0.0);//Ser marker color to red.
    for (k = 0; k < 12; k++) {//Plot data as asterisk polymakers.
        glRasterPos2i(xRaster + k * 50, dataValue[k] - 4);
        glutBitmapCharacter(GLUT_BITMAP_9_BY_15, '*');
    }

    glColor3f(0.0, 0.0, 0.0);//Ser test color to black.
    xRaster = 20;//Display chart labels.
    for (month = 0; month < 12; month++) {
        glRasterPos2i(xRaster, yRaster);
        for (k = 3 * month; k < 3 * month + 3; k++)
            glutBitmapCharacter(GLUT_BITMAP_HELVETICA_12, label[k]);
        xRaster += 50;

    }
    glFlush();
}


void winReshapeFcn(GLint newWidth, GLint newHeight)
{
    glMatrixMode(GL_PROJECTION);
    glLoadIdentity();
    gluOrtho2D(0.0, GLdouble(newWidth), 0.0, GLdouble(newHeight));
    glClear(GL_COLOR_BUFFER_BIT);

}
void main(int argc, char** argv)
{
    glutInit(&argc, argv);
    glutInitDisplayMode(GLUT_SINGLE | GLUT_RGB);
    glutInitWindowPosition(100, 100);
    glutInitWindowSize(winWidth, winHeight);
    glutCreateWindow("Line Chart Data Plot");

    init();
    glutDisplayFunc(lineGraph);
    glutReshapeFunc(winReshapeFcn);
    glutMainLoop();
}