tensorflow真是一个我绕不开的坑(苍天饶过谁.jpg)
其实tensorflow1和2的差别挺大的,暂时从1入坑,2的话之后简单过一下。
tf2中更改的函数(供参考):https://docs.google.com/spreadsheets/d/1FLFJLzg7WNP6JHODX5q8BDgptKafq_slHpnHVbJIteQ/edit#gid=0
本文仅记录我的踩坑历程。
参考文献:https://www.datacamp.com/community/tutorials/tensorflow-tutorial
数据来源:https://btsd.ethz.ch/shareddata/
基础知识部分另外编写,这里只记录操作和结果。
import skimage
import tensorflow as tf
from skimage import io # [MUST] for skimage.io.imread
import os
import matplotlib.pyplot as plt # draw distribution graph
from skimage import transform
from skimage.color import rgb2gray # convert img to grayscale
import numpy as np

def first_try():
    # initialize constant
    x1 = tf.constant([1,2,3,4])
    x2 = tf.constant([5,6,7,8])
    # multiply
    result = tf.multiply(x1, x2)
    # only return a tensor, not real-value
    # that means: tf does not calculate. only deprive a graph
    print(result) # Tensor("Mul:0", shape=(4,), dtype=int32)
    # run result and print. 'with' will close automatically
    #sess = tf.Session()
    #print(sess.run(result))
    #sess.close()
    with tf.Session() as sess:
        output = sess.run(result)
        print(output)

def load_data(data_dir):
    dirs = [d for d in os.listdir(data_dir)
            if os.path.isdir(os.path.join(data_dir, d))]
    labels = []
    images = []
    # each type of sign
    for d in dirs:
        # .ppm 's file name
        label_dir = os.path.join(data_dir, d)
        # real path of .ppm
        file_names = [os.path.join(label_dir, f)
                      for f in os.listdir(label_dir)
                      if f.endswith(".ppm")]
        for f in file_names:
            # load image
            images.append(skimage.io.imread(f))
            labels.append(int(d))
    return images, labels

def random_show(images, name, cmap=None):
    for i in range(len(name)):
        plt.subplot(1, len(name), i+1)
        plt.axis('off')
        # add cmap for gray-scaled pic, which set cmap='gray'
        # or u'll get wrong color
        plt.imshow(images[name[i]], cmap)
        plt.subplots_adjust(wspace=0.5)
        print("shape: {0}, min: {1}, max: {2}".format(images[name[i]].shape,
                                                      images[name[i]].min(),
                                                      images[name[i]].max()))
    plt.show()


def show_each_label_pic(labels):
    uniq_labels = set(labels)
    # initialize the figure
    plt.figure(figsize=(15, 15))
    i = 1
    for label in uniq_labels:
        # pick the 1st image for each label
        image = images[labels.index(label)]
        # 8X8, ith
        plt.subplot(8, 8, i)
        plt.axis('off')
        plt.title("Label {0} ({1})".format(label, labels.count(label)))
        i += 1
        plt.imshow(image) # plot single picture
    plt.show()

def transform_img(images, rows, cols):
    return [transform.resize(image, (rows, cols)) for image in images]

def to_gray(images):
    # need array
    return rgb2gray(np.array(images))

if __name__=="__main__":
    ROOT_PATH = r"G:/share/testTF"
    train_data_dir = ROOT_PATH + "/Training"
    images, labels = load_data(train_data_dir)
    #print(len(set(labels))) # 62. coz 62 type of traffic signs
    #print(len(images)) # 4575
    #plt.hist(labels, 63) # draw a bar-graph.
    #plt.show()
    #random_show(images, [300, 2250, 3650, 4000])
    #print(type(images[0])) # <class 'numpy.ndarray'>
    #show_each_label_pic(labels)
    images28 = transform_img(images, 28, 28)
    #random_show(images28, [300, 2250, 3650, 4000])
    gray_images28 = to_gray(images28)
    random_show(gray_images28, [300, 2250, 3650, 4000], cmap="gray")
图像:
条形图:

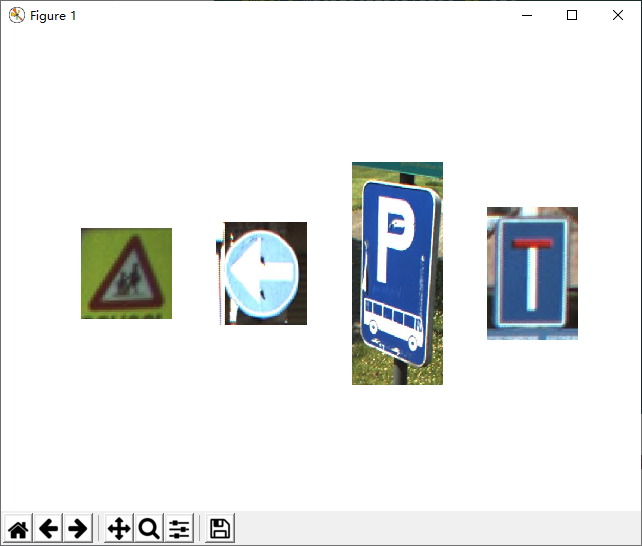
随机查看的四个图:
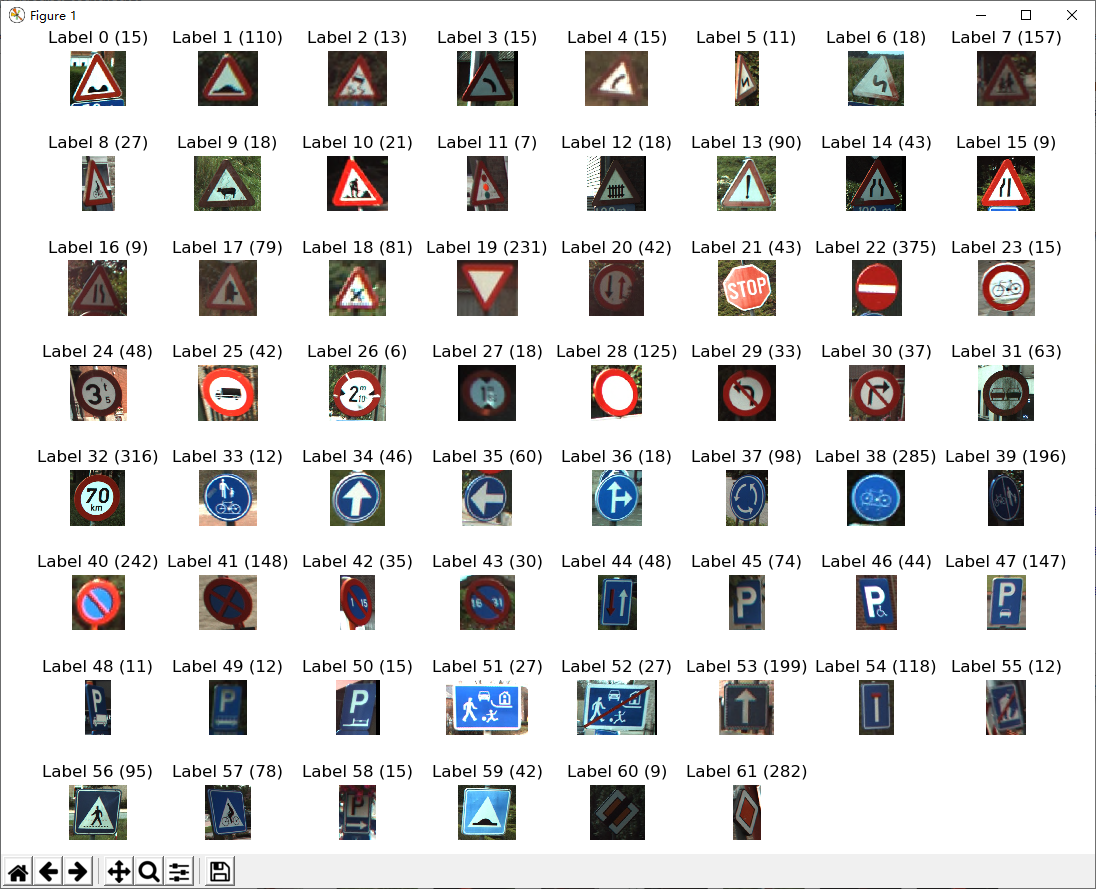
统计一下每个label有多少个图:


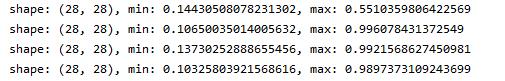
而且这个resize之后数据其实进行了归一化,进到(0,1)了
灰度图怎么样:这里转化成灰度图是因为作者说,当前问题中,颜色在分类时不起作用。这一点我随后会再验证。
