在做数据分析或者统计的时候,经常需要进行数据正态性的检验,因为很多假设都是基于正态分布的基础之上的,例如:T检验。
在Python中,主要有以下检验正态性的方法:
1. scipy.stats.shapiro —— Shapiro-Wilk test,属于专门用来做正态性检验的模块,其原假设:样本数据符合正态分布。
注:适用于小样本。
其函数定位为:
def shapiro(x):
    """
    Perform the Shapiro-Wilk test for normality.

    The Shapiro-Wilk test tests the null hypothesis that the
    data was drawn from a normal distribution.

    Parameters
    ----------
    x : array_like
        Array of sample data.

    Returns
    -------
    W : float
        The test statistic.
    p-value : float
        The p-value for the hypothesis test.
x参数为样本值序列,返回值中第一个为检验统计量,第二个为P值,当P值大于指定的显著性水平,则接受原假设。
2. scipy.stats.kstest(K-S检验):可以检验多种分布,不止正态分布,其原假设:数据符合正态分布。
其函数定义为:
def kstest(rvs, cdf, args=(), N=20, alternative='two-sided', mode='approx'):
    """
    Perform the Kolmogorov-Smirnov test for goodness of fit.

    This performs a test of the distribution G(x) of an observed
    random variable against a given distribution F(x). Under the null
    hypothesis the two distributions are identical, G(x)=F(x). The
    alternative hypothesis can be either 'two-sided' (default), 'less'
    or 'greater'. The KS test is only valid for continuous distributions.

    Parameters
    ----------
    rvs : str, array or callable
        If a string, it should be the name of a distribution in `scipy.stats`.
        If an array, it should be a 1-D array of observations of random
        variables.
        If a callable, it should be a function to generate random variables;
        it is required to have a keyword argument `size`.
    cdf : str or callable
        If a string, it should be the name of a distribution in `scipy.stats`.
        If `rvs` is a string then `cdf` can be False or the same as `rvs`.
        If a callable, that callable is used to calculate the cdf.
    args : tuple, sequence, optional
        Distribution parameters, used if `rvs` or `cdf` are strings.
    N : int, optional
        Sample size if `rvs` is string or callable.  Default is 20.
    alternative : {'two-sided', 'less','greater'}, optional
        Defines the alternative hypothesis (see explanation above).
        Default is 'two-sided'.
    mode : 'approx' (default) or 'asymp', optional
        Defines the distribution used for calculating the p-value.

          - 'approx' : use approximation to exact distribution of test statistic
          - 'asymp' : use asymptotic distribution of test statistic

    Returns
    -------
    statistic : float
        KS test statistic, either D, D+ or D-.
    pvalue :  float
        One-tailed or two-tailed p-value.
参数是:
rvs:待检验数据。
cdf:检验分布,例如'norm','expon','rayleigh','gamma'等分布,设置为'norm'时表示正态分布。
alternative:默认为双侧检验,可以设置为'less'或'greater'作单侧检验。
model:'approx'(默认值),表示使用检验统计量的精确分布的近视值;'asymp':使用检验统计量的渐进分布。
其返回值中第一个为统计量,第二个为P值。
3. scipy.stats.normaltest:正态性检验,其原假设:样本来自正态分布。
其函数定义为:
def normaltest(a, axis=0, nan_policy='propagate'):
    """
    Test whether a sample differs from a normal distribution.

    This function tests the null hypothesis that a sample comes
    from a normal distribution.  It is based on D'Agostino and
    Pearson's [1]_, [2]_ test that combines skew and kurtosis to
    produce an omnibus test of normality.


    Parameters
    ----------
    a : array_like
        The array containing the sample to be tested.
    axis : int or None, optional
        Axis along which to compute test. Default is 0. If None,
        compute over the whole array `a`.
    nan_policy : {'propagate', 'raise', 'omit'}, optional
        Defines how to handle when input contains nan. 'propagate' returns nan,
        'raise' throws an error, 'omit' performs the calculations ignoring nan
        values. Default is 'propagate'.

    Returns
    -------
    statistic : float or array
        ``s^2 + k^2``, where ``s`` is the z-score returned by `skewtest` and
        ``k`` is the z-score returned by `kurtosistest`.
    pvalue : float or array
       A 2-sided chi squared probability for the hypothesis test.
其参数:
axis=None 可以表示对整个数据做检验,默认值是0。
nan_policy:当输入的数据中有nan时,'propagate',返回空值;'raise' 时,抛出错误;'omit' 时,忽略空值。
其返回值中,第一个是统计量,第二个是P值。
4. scipy.stats.anderson:由 scipy.stats.kstest 改进而来,用于检验样本是否属于某一分布(正态分布、指数分布、logistic 或者 Gumbel等分布)
其函数定义为:
def anderson(x, dist='norm'):
    """
    Anderson-Darling test for data coming from a particular distribution

    The Anderson-Darling tests the null hypothesis that a sample is
    drawn from a population that follows a particular distribution.
    For the Anderson-Darling test, the critical values depend on
    which distribution is being tested against.  This function works
    for normal, exponential, logistic, or Gumbel (Extreme Value
    Type I) distributions.

    Parameters
    ----------
    x : array_like
        array of sample data
    dist : {'norm','expon','logistic','gumbel','gumbel_l', gumbel_r',
        'extreme1'}, optional
        the type of distribution to test against.  The default is 'norm'
        and 'extreme1', 'gumbel_l' and 'gumbel' are synonyms.

    Returns
    -------
    statistic : float
        The Anderson-Darling test statistic
    critical_values : list
        The critical values for this distribution
    significance_level : list
        The significance levels for the corresponding critical values
        in percents.  The function returns critical values for a
        differing set of significance levels depending on the
        distribution that is being tested against.
其参数:
x和dist分别表示样本数据和分布。
返回值有三个,第一个表示统计值,第二个表示评价值,第三个是显著性水平;评价值和显著性水平对应。
对于不同的分布,显著性水平不一样。
    Critical values provided are for the following significance levels:

    normal/exponenential
        15%, 10%, 5%, 2.5%, 1%
    logistic
        25%, 10%, 5%, 2.5%, 1%, 0.5%
    Gumbel
        25%, 10%, 5%, 2.5%, 1%
关于统计值与评价值的对比:当统计值大于这些评价值时,表示在对应的显著性水平下,原假设被拒绝,即不属于某分布。
    If the returned statistic is larger than these critical values then
    for the corresponding significance level, the null hypothesis that
    the data come from the chosen distribution can be rejected.
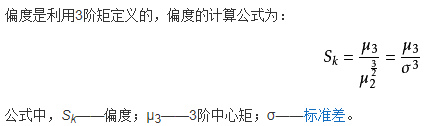
5. skewtest 和 kurtosistest 检验:用于检验样本的skew(偏度)和kurtosis(峰度)是否与正态分布一致,因为正态分布的偏度=0,峰度=3。
偏度:偏度是样本的标准三阶中心矩。
峰度:峰度是样本的标准四阶中心矩。

6. 代码如下:
import numpy as np
from scipy import stats

a = np.random.normal(0,2,50)
b = np.linspace(0, 10, 100)

# Shapiro-Wilk test
S,p = stats.shapiro(a)
print('the shapiro test result is:',S,',',p)

# kstest(K-S检验)
K,p = stats.kstest(a, 'norm')
print(K,p)

# normaltest
N,p = stats.normaltest(b)
print(N,p)

# Anderson-Darling test
A,C,p = stats.anderson(b,dist='norm')
print(A,C,p)
参考:
https://www.cnblogs.com/yanshw/p/12677976.html
https://www.cnblogs.com/shona/p/12364216.html
https://baike.baidu.com/item/%E5%81%8F%E5%BA%A6/8626571?fr=aladdin