决策树优特点:
优点:计算复杂度不高,输出结果易于理解,对中间值的缺失不敏感,可以处理不相关特
征数据。
缺点:可能会产生过度匹配问题。
适用数据类型:数值型和标称型
使用ID3算法划分数据集并构建决策树:
from math import log
import pickle

#计算香农熵
def calcShannonEnt(dataSet):
    numEntries = len(dataSet)
    labelCounts = { }
    # 统计每个label数据集的个数
    for featVec in dataSet:
        currentLabel = featVec[-1]
        if(currentLabel not in labelCounts.keys()):
            labelCounts[currentLabel] = 0
        labelCounts[currentLabel] += 1
    # 计算香农熵
    shannonEnt = 0.0
    for key in labelCounts:
        prob = float(labelCounts[key]) / float(numEntries);
        shannonEnt -= prob * log(prob, 2)

    return shannonEnt

#creat data set just for test funcations
def creatDataSet():
    dataSet = [[1, 1, 'yes'],
               [1, 1, 'yes'],
               [1, 0, 'no'],
               [0, 1, 'no'],
               [0, 1, 'no']]
    labels = ['no surfacing', 'flippers']
    return dataSet, labels

# 按照给定特征 和 特征值 划分数据集(提取数据集)
def splitDataSet(dataSet, axis, value):
    retDataSet = []
    for i in dataSet:
        if i[axis] == value:
            dataTemp = i[:axis]
            dataTemp.extend(i[axis+1:])
            retDataSet.append(dataTemp)

    return retDataSet

# 利用信息增益寻找最好的数据集划分方式,返回最适合特征值的索引
def chooseBestFeatureToSplit(dataSet):
    numFeatures = len(dataSet[0]) - 1
    # 初始信息熵
    baseShannonEnt = calcShannonEnt(dataSet)
    # 最大信息熵
    bestInfoGain = 0.0
    # 最好特征值
    bestFeature = -1
    # 寻找使得信息增益最大的划分方式
    for i in range(numFeatures):
        featList = [example[i] for example in dataSet]
        uniqueFeatList = set(featList)
        newEnt = 0.0
        for feature in uniqueFeatList:
            subDataSet = splitDataSet(dataSet, i, feature)
            prob = float(len(subDataSet)) / float(len(dataSet))
            newEnt += prob * calcShannonEnt(subDataSet)

        infoGain = baseShannonEnt - newEnt
        if(infoGain > bestInfoGain):
            bestInfoGain = infoGain
            bestFeature = i

    return bestFeature

# 当特征值被消耗完,但是剩余数据集并不是同一类时,进行投票
def majorityCnt(classList):
    classCount = { }
    for i in classList:
        if (i not in classCount.keys()):
            classCount[i] = 0
        classCount[i] += 1

    sortedClassCount = sorted(classCount.items(), key = lambda item:item[1], reverse = True)
    return sortedClassCount[0][0]

# 构造决策树
def creatTree(dataSet, label):
    labels = label[:]
    classList = [example[-1] for example in dataSet]
    # 类别完全相同时,停止划分, 返回类别
    if classList.count(classList[0]) == len(classList):
        return classList[0]
    # 当所有特征都已经被消耗完毕
    if len(dataSet[0]) == 1:
        return majorityCnt(classList)
    # 寻找最好的划分特征值
    bestFeat = chooseBestFeatureToSplit(dataSet)
    bestFeatLabel = labels[bestFeat]

    myTree = {bestFeatLabel:{ }}
    del(labels[bestFeat])

    featValues = [example[bestFeat] for example in dataSet]
    uniqueFeatValues = set(featValues)
    for value in uniqueFeatValues:
        subLabels = labels[:]
        myTree[bestFeatLabel][value] = creatTree(splitDataSet(dataSet, bestFeat, value), subLabels)

    return myTree

# 使用构造好的决策树对测试集进行分类
def classify(inputTree, featLabels, testVector):
    firstStr = list(inputTree.keys())[0]
    secondDict = inputTree[firstStr]
    featIndex = featLabels.index(firstStr)
    for key in secondDict.keys():
        if testVector[featIndex] == key:
            if type(secondDict[key]).__name__ == 'dict':
                classType = classify(secondDict[key], featLabels, testVector)
            else:
                classType = secondDict[key]

    return classType

# 存储决策树
def storeTree(inputTree, fileName):
    fw = open(fileName, 'wb')
    pickle.dump(inputTree, fw)
    fw.close()


#读取决策树
def grabTree(fileName):
    fr = open(fileName, 'rb')
    return pickle.load(fr)

fr = open("lenses.txt")
allLines = fr.readlines()
lensesDataSet = [line.strip().split('	') for line in allLines]
lensesLabels = ['age', 'prescript', 'astigmatic', 'rearRate']

lensesTree = creatTree(lensesDataSet, lensesLabels)
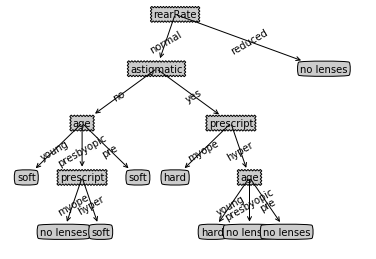
利用matplotlib注解绘制树形图:
import matplotlib.pyplot as plt
import pickle

decisionNode = dict(boxstyle = "sawtooth", fc = "0.8")
leafNode = dict(boxstyle = "round4", fc = "0.8")
arrow_args = dict(arrowstyle = "<-")

def retrieveTree(i):
    listOfTrees =[{'no surfacing': {0: 'no', 1: {'flippers': {0: 'no', 1: 'yes'}}}},
                  {'no surfacing': {0: 'no', 1: {'flippers': {0: {'head': {0: 'no', 1: 'yes'}}, 1: 'no'}}}}
                  ]
    return listOfTrees[i]

def getNumLeafs(myTree):
    numLeafs = 0
    firstStr = list(myTree.keys())[0]
    secondDict = myTree[firstStr]
    for key in secondDict.keys():
        if type(secondDict[key]).__name__=='dict':#test to see if the nodes are dictonaires, if not they are leaf nodes
            numLeafs += getNumLeafs(secondDict[key])
        else:   numLeafs +=1
    return numLeafs

def getTreeDepth(myTree):
    maxDepth = 0
    firstStr = list(myTree.keys())[0]
    secondDict = myTree[firstStr]
    for key in secondDict.keys():
        if type(secondDict[key]).__name__=='dict':#test to see if the nodes are dictonaires, if not they are leaf nodes
            thisDepth = 1 + getTreeDepth(secondDict[key])
        else:   thisDepth = 1
        if thisDepth > maxDepth: maxDepth = thisDepth
    return maxDepth

def plotNode(nodeTxt, centerPt, parentPt, nodeType):
    createPlot.ax1.annotate(nodeTxt, xy=parentPt,  xycoords='axes fraction',
             xytext=centerPt, textcoords='axes fraction',
             va="center", ha="center", bbox=nodeType, arrowprops=arrow_args )

def plotMidText(cntrPt, parentPt, txtString):
    xMid = (parentPt[0]-cntrPt[0])/2.0 + cntrPt[0]
    yMid = (parentPt[1]-cntrPt[1])/2.0 + cntrPt[1]
    createPlot.ax1.text(xMid, yMid, txtString, va="center", ha="center", rotation=30)

def plotTree(myTree, parentPt, nodeTxt):#if the first key tells you what feat was split on
    numLeafs = getNumLeafs(myTree)  #this determines the x width of this tree
    depth = getTreeDepth(myTree)
    firstStr = list(myTree.keys())[0]     #the text label for this node should be this
    cntrPt = (plotTree.xOff + (1.0 + float(numLeafs))/2.0/plotTree.totalW, plotTree.yOff)
    plotMidText(cntrPt, parentPt, nodeTxt)
    plotNode(firstStr, cntrPt, parentPt, decisionNode)
    secondDict = myTree[firstStr]
    plotTree.yOff = plotTree.yOff - 1.0/plotTree.totalD
    for key in secondDict.keys():
        if type(secondDict[key]).__name__=='dict':#test to see if the nodes are dictonaires, if not they are leaf nodes
            plotTree(secondDict[key],cntrPt,str(key))        #recursion
        else:   #it's a leaf node print the leaf node
            plotTree.xOff = plotTree.xOff + 1.0/plotTree.totalW
            plotNode(secondDict[key], (plotTree.xOff, plotTree.yOff), cntrPt, leafNode)
            plotMidText((plotTree.xOff, plotTree.yOff), cntrPt, str(key))
    plotTree.yOff = plotTree.yOff + 1.0/plotTree.totalD
#if you do get a dictonary you know it's a tree, and the first element will be another dict

def createPlot(inTree):
    fig = plt.figure(1, facecolor='white')
    fig.clf()
    axprops = dict(xticks=[], yticks=[])
    createPlot.ax1 = plt.subplot(111, frameon=False, **axprops)    #no ticks
    #createPlot.ax1 = plt.subplot(111, frameon=False) #ticks for demo puropses
    plotTree.totalW = float(getNumLeafs(inTree))
    plotTree.totalD = float(getTreeDepth(inTree))
    plotTree.xOff = -0.5/plotTree.totalW; plotTree.yOff = 1.0;
    plotTree(inTree, (0.5,1.0), '')
    plt.show()

# 存储决策树
def storeTree(inputTree, fileName):
    fw = open(fileName, 'wb')
    pickle.dump(inputTree, fw)
    fw.close()


#读取决策树
def grabTree(fileName):
    fr = open(fileName, 'rb')
    return pickle.load(fr)
myTree = grabTree('lensesTree.txt')
createPlot(myTree)
数据集下载以及完整jupyter notebook 代码下载:
https://github.com/qwqwqw110/machineLearningInactionCode/tree/master/%E5%86%B3%E7%AD%96%E6%A0%91