在本系列文章中提到过用Python机器学习(2)数据拟合与广义线性回归中提到过回归算法来进行数值预测。逻辑回归算法本质还是回归,只是其引入了逻辑函数来帮助其分类。实践发现,逻辑回归在文本分类领域表现的也很优秀。现在让我们来一探究竟。
1、逻辑函数
假设数据集有n个独立的特征,x1到xn为样本的n个特征。常规的回归算法的目标是拟合出一个多项式函数,使得预测值与真实值的误差最小:
而我们希望这样的f(x)能够具有很好的逻辑判断性质,最好是能够直接表达具有特征x的样本被分到某类的概率。比如f(x)>0.5的时候能够表示x被分为正类,f(x)<0.5表示分为反类。而且我们希望f(x)总在[0, 1]之间。有这样的函数吗?
sigmoid函数就出现了。这个函数的定义如下:
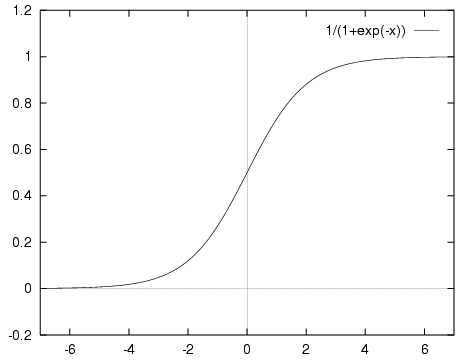
先直观的了解一下,sigmoid函数的图像如下所示(来自http://computing.dcu.ie/~humphrys/Notes/Neural/sigmoid.html):
sigmoid函数具有我们需要的一切优美特性,其定义域在全体实数,值域在[0, 1]之间,并且在0点值为0.5。
那么,如何将f(x)转变为sigmoid函数呢?令p(x)=1为具有特征x的样本被分到类别1的概率,则p(x)/[1-p(x)]被定义为让步比(odds ratio)。引入对数:
上式很容易就能把p(x)解出来得到下式:
现在,我们得到了需要的sigmoid函数。接下来只需要和往常的线性回归一样,拟合出该式中n个参数c即可。
2、测试数据
测试数据我们仍然选择康奈尔大学网站的2M影评数据集。
在这个数据集上我们已经测试过KNN分类算法、朴素贝叶斯分类算法。现在我们看看罗辑回归分类算法在处理此类情感分类问题效果如何。
同样的,我们直接读入保存好的movie_data.npy和movie_target.npy以节省时间。
3、代码与分析
逻辑回归的代码如下:
# -*- coding: utf-8 -*-
from matplotlib import pyplot
import scipy as sp
import numpy as np
from matplotlib import pylab
from sklearn.datasets import load_files
from sklearn.cross_validation import train_test_split
from sklearn.feature_extraction.text import  CountVectorizer
from sklearn.feature_extraction.text import  TfidfVectorizer
from sklearn.naive_bayes import MultinomialNB
from sklearn.metrics import precision_recall_curve, roc_curve, auc
from sklearn.metrics import classification_report
from sklearn.linear_model import LogisticRegression
import time

start_time = time.time()

#绘制R/P曲线
def plot_pr(auc_score, precision, recall, label=None):
    pylab.figure(num=None, figsize=(6, 5))
    pylab.xlim([0.0, 1.0])
    pylab.ylim([0.0, 1.0])
    pylab.xlabel('Recall')
    pylab.ylabel('Precision')
    pylab.title('P/R (AUC=%0.2f) / %s' % (auc_score, label))
    pylab.fill_between(recall, precision, alpha=0.5)
    pylab.grid(True, linestyle='-', color='0.75')
    pylab.plot(recall, precision, lw=1)
    pylab.show()

#读取
movie_data   = sp.load('movie_data.npy')
movie_target = sp.load('movie_target.npy')
x = movie_data
y = movie_target

#BOOL型特征下的向量空间模型,注意,测试样本调用的是transform接口
count_vec = TfidfVectorizer(binary = False, decode_error = 'ignore',
                            stop_words = 'english')
average = 0
testNum = 10
for i in range(0, testNum):
    #加载数据集,切分数据集80%训练,20%测试
    x_train, x_test, y_train, y_test
        = train_test_split(movie_data, movie_target, test_size = 0.2)
    x_train = count_vec.fit_transform(x_train)
    x_test  = count_vec.transform(x_test)

    #训练LR分类器
    clf = LogisticRegression()
    clf.fit(x_train, y_train)
    y_pred = clf.predict(x_test)
    p = np.mean(y_pred == y_test)
    print(p)
    average += p


#准确率与召回率
answer = clf.predict_proba(x_test)[:,1]
precision, recall, thresholds = precision_recall_curve(y_test, answer)
report = answer > 0.5
print(classification_report(y_test, report, target_names = ['neg', 'pos']))
print("average precision:", average/testNum)
print("time spent:", time.time() - start_time)

plot_pr(0.5, precision, recall, "pos")
代码运行结果如下:
0.8
0.817857142857
0.775
0.825
0.807142857143
0.789285714286
0.839285714286
0.846428571429
0.764285714286
0.771428571429
precision recall f1-score support
neg 0.74 0.80 0.77 132
pos 0.81 0.74 0.77 148
avg / total 0.77 0.77 0.77 280
average precision: 0.803571428571
time spent: 9.651551961898804
首先注意我们连续测试了10组测试样本,最后统计出准确率的平均值。另外一种好的测试方法是K折交叉检验(K-Fold)。这样都能更加准确的评估分类器的性能,考察分类器对噪音的敏感性。
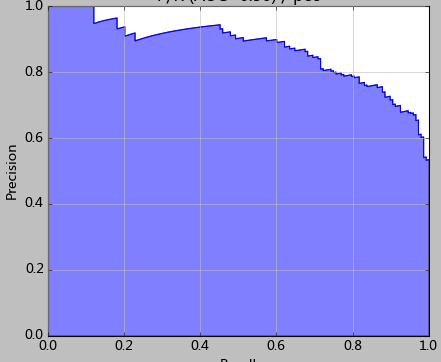
其次我们注意看最后的图,这张图就是使用precision_recall_curve绘制出来的P/R曲线(precition/Recall)。结合P/R图,我们能对逻辑回归有更进一步的理解。
前文我们说过,通常我们使用0.5来做划分两类的依据。而结合P/R分析,阈值的选取是可以更加灵活和优秀的。
在上图可以看到,如果选择的阈值过低,那么更多的测试样本都将分为1类。因此召回率能够得到提升,显然准确率牺牲相应准确率。
比如本例中,或许我会选择0.42作为划分值——因为该点的准确率和召回率都很高。
最后给一些比较好的资源:
浙大某女学霸的博客!记录的斯坦福Andrew老师主讲的LR公开课笔记:http://blog.csdn.net/abcjennifer/article/details/7716281
一个总结LR还不错的博客:http://xiamaogeng.blog.163.com/blog/static/1670023742013231197530/
Sigmoid函数详解:http://computing.dcu.ie/~humphrys/Notes/Neural/sigmoid.html


