《综合》主从,读写,调优
1 实现MySQL读写分离
1.1 问题
本案例要求配置2台MySQL服务器+1台代理服务器,实现MySQL代理的读写分离:
- 用户只需要访问MySQL代理服务器,而实际的SQL查询、写入操作交给后台的2台MySQL服务器来完成
- 其中Master服务器允许SQL查询、写入,Slave服务器只允许SQL查询
1.2 方案
使用4台RHEL 7.2虚拟机,如图-1所示。其中192.168.4.10、192.168.4.20分别作为MySQL主、从服务器,是整个服务的后端;另一台192.168.4.100作为MySQL代理服务器,是直接面向客户的服务前端;客户机192.168.4.120用作访问测试。
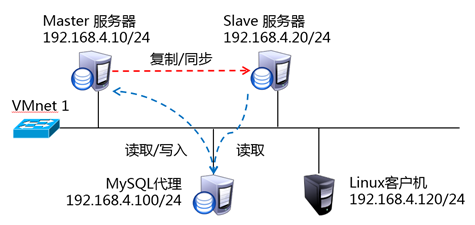
图-1
对比两种方式的读写分离效果——
- MySQL主从复制:客户机访问Master服务器来写数据库,客户机访问Slave服务器来读数据库。这种情况下,需要客户端自行区分向何处写、从何处读。
- MySQL主从复制+代理:客户机访问Proxy服务器,读、写请求交给Proxy识别,如果是写数据库操作则交给Master,如果是读数据库操作则交给Slave处理,具体由分配策略控制。这种情况下,无需客户端区分读、写目标,而是由Proxy服务器代劳了,从而降低了客户端程序的复杂度。
其中MySQL主、从复制结构的搭建参考前面的课程,这里不再赘述。
1.3 步骤
实现此案例需要按照如下步骤进行。
步骤一:部署mysql-proxy代理服务器
1)安装mariadb官方提供的maxscale软件包
- [root@bogon ~]# rpm -ivh maxscale-2.1.2-1.rhel.7.x86_64.rpm
修改配置文件:
- [root@pxysvr pub]# [root@bogon ~]# grep -E -v '^#' /etc/maxscale.cnf
- [maxscale]
- threads=1
- [server1] #指定ip地址对应的名字
- type=server
- address=192.168.4.10 #主数据库服务器ip地址
- port=3306
- protocol=MySQLBackend
- [server2] #指定ip地址对应的名字
- type=server
- address=192.168.4.20 #从数据库服务器ip地址
- port=3306
- protocol=MySQLBackend
- [MySQL Monitor] #指定要监控的主机 和监控时连接的用户
- type=monitor
- module=mysqlmon
- servers=server1, server2 #前边定义的主机名
- user=scalemon # 用户名
- passwd=111111 # 密码
- monitor_interval=10000
- #[Read-Only Service]
- #type=service
- #router=readconnroute
- #servers=server1
- #user=myuser
- #passwd=mypwd
- #router_options=slave
- [Read-Write Service] #定义服务器列表
- type=service
- router=readwritesplit
- servers=server1, server2 #前边定义的主机名
- user=maxscale # 用户名
- passwd=111111 # 密码
- max_slave_connections=100%
- [MaxAdmin Service]
- type=service
- router=cli
- #[Read-Only Listener]
- #type=listener
- #service=Read-Only Service
- #protocol=MySQLClient
- #port=4008
- [Read-Write Listener]
- type=listener
- service=Read-Write Service
- protocol=MySQLClient
- port=4006
- [MaxAdmin Listener]
- type=listener
- service=MaxAdmin Service
- protocol=maxscaled
- socket=default
- [root@bogon ~]#
分别在主、从数据库服务器上添加授权用户(只在主服务器授权即可 从服务器会自动同步):
- [root@pxysvr pub]# mysql> grant replication slave, replication client on *.* to scalemon@'%' identified by “111111”; //创建监控用户
- mysql> grant select on mysql.* to maxscale@'%' identified by “111111”; //创建路由用户
- mysql> grant all on *.* to student@'%' identified by “111111”;
- //创建客户端访问用户
2)启动maxscale服务
- [root@bogon ~]# maxscale --config=/etc/maxscale.cnf
- [root@bogon ~]# netstat -utnalp | grep maxscale
- tcp 0 0 192.168.4.100:58960 192.168.4.10:3306 ESTABLISHED 19081/maxscale
- tcp 0 0 192.168.4.100:43508 192.168.4.20:3306 ESTABLISHED 19081/maxscale
- tcp6 0 0 :::4006 :::* LISTEN 19081/maxscale
- [root@bogon ~]# kill -9 19081 //通过杀进程的方式停止服务
步骤二:测试配置
1)在客户端192.168.4.120上使用上边授权用户student 连接代理服务器192.168.4.100:
- [root@bogon ~]# mysql -h192.168.4.100 -P4006 -ustudent -p111111
- MySQL [(none)]> select @@hostname; //显示当前访问的主机
- +----------------+
- | @@hostname |
- +----------------+
- | slave20 | //显示的是从服务器的主机名
- +----------------+
- Query OK, 0 rows affected (0.00 sec)
- MySQL [(none)]> insert into bbsdb.a values(111);//插入新纪录
客户端当前访问的是从数据库服务器,仍然能够插入纪录。表示成功。
2 MySQL性能调优
2.1 问题
基于一台普通版的MySQL服务器,执行下列操作:
- 练习my.cnf配置相关选项
- 启用慢查询日志
- 查看各种系统变量、状态变量
2.2 步骤
实现此案例需要按照如下步骤进行。
步骤一:MySQL并发及连接控制
max_connections对应并发客户端连接的数量,增加该值会增加 mysqld 要求的文件描述符的数量。若这个数值太小,可能会经常出现“too many connections”错误。比如 默认的数值是151,可以将其改为1024。
1)查看当前已建立的连接数
- mysql> FLUSH STATUS;
- Query OK, 0 rows affected (0.00 sec)
- mysql> SHOW GLOBAL STATUS LIKE 'max_used_connections';
- +----------------------+-------+
- | Variable_name | Value |
- +----------------------+-------+
- | Max_used_connections | 5 |
- +----------------------+-------+
- 1 row in set (0.05 sec)
2)查看当前的最大连接数限制
- mysql> SHOW VARIABLES LIKE 'max_connections';
- +-----------------+-------+
- | Variable_name | Value |
- +-----------------+-------+
- | max_connections | 151 |
- +-----------------+-------+
- 1 row in set (0.00 sec)
步骤二:MySQL缓存参数控制
当 Key_reads / Key_read_requests 较低时,可适当加大key_buffer_size的缓存值,以提高性能。而增大sort_buffer_size的值,可以显著提高ORDER和GROUP的响应速度。
1)查看key_read相关数值
- mysql> SHOW GLOBAL STATUS LIKE 'key_read%';
- +-------------------+-------+
- | Variable_name | Value |
- +-------------------+-------+
- | Key_read_requests | 0 |
- | Key_reads | 0 |
- +-------------------+-------+
- 2 rows in set (0.00 sec)
2)查看当前的key_buffer_size缓存大小
- mysql> SHOW VARIABLES LIKE 'key_buffer_size';
- +-----------------+---------+
- | Variable_name | Value |
- +-----------------+---------+
- | key_buffer_size | 8388608 |
- +-----------------+---------+
- 1 row in set (0.03 sec)
3)查看当前的sort_buffer_size大小
- mysql> SHOW VARIABLES LIKE 'sort_buffer_size';
- +------------------+--------+
- | Variable_name | Value |
- +------------------+--------+
- | sort_buffer_size | 262144 |
- +------------------+--------+
- 1 row in set (0.00 sec)
4)查看检索表记录时的读取缓存大小
缓存值read_buffer_size和read_rnd_buffer_size会影响SQL查询的响应速度:
- mysql> SHOW VARIABLES LIKE 'read_%_size';
- +----------------------+--------+
- | Variable_name | Value |
- +----------------------+--------+
- | read_buffer_size | 131072 |
- | read_rnd_buffer_size | 262144 |
- +----------------------+--------+
- 2 rows in set (0.00 sec)
步骤三:MySQL线程重用和开表控制
分析“已打开表的数量/当前可缓存表的数量”,比值不超过95%就基本正常。
1)查看当前已打开、一共打开过多少个表
- mysql> SHOW GLOBAL STATUS LIKE 'open%tables';
- +---------------+-------+
- | Variable_name | Value |
- +---------------+-------+
- | Open_tables | 23 |
- | Opened_tables | 72 |
- +---------------+-------+
- 2 rows in set (0.01 sec)
2)查看当前可缓存多少个打开的表
- mysql> SHOW VARIABLES LIKE 'table_open_cache';
- +------------------+-------+
- | Variable_name | Value |
- +------------------+-------+
- | table_open_cache | 2000 |
- +------------------+-------+
- 1 row in set (0.00 sec)
步骤四:MySQL调整示例:记录慢查询
1)调整my.cnf配置文件,启用慢查询
- [root@dbsvr1 ~]# vim /etc/my.cnf
- [mysqld]
- .. ..
- slow_query_log=1 //启用慢查询
- slow_query_log_file=mysql-slow.log //制定慢查询日志文件
- long_query_time=5 //查询耗时超过5秒才记录
- log_queries_not_using_indexes=1 //记录未使用索引的查询
- [root@dbsvr1 ~]# service mysql restart
- Shutting down MySQL..... [确定]
- Starting MySQL.... [确定]
2)查看慢查询日志(mysqldumpslow工具)
- [root@dbsvr1 ~]# mysqldumpslow /var/lib/mysql/mysql-slow.log
- Reading mysql slow query log from /var/lib/mysql/mysql-slow.log
- Count: 1 Time=0.00s (0s) Lock=0.00s (0s) Rows=0.0 (0), 0users@0hosts
- .. ..
3)了解与查询相关的缓存选项
查看当前的查询缓存大小:
- mysql> SHOW VARIABLES LIKE 'query_cache%';
- +------------------------------+---------+
- | Variable_name | Value |
- +------------------------------+---------+
- | query_cache_limit | 1048576 | //超过此大小则不再缓存
- | query_cache_min_res_unit | 4096 |
- | query_cache_size | 1048576 | //缓存空间的大小
- | query_cache_type | OFF |
- | query_cache_wlock_invalidate | OFF |
- +------------------------------+---------+
- 5 rows in set (0.00 sec)
查看当前的查询缓存统计数据:
- mysql> SHOW GLOBAL STATUS LIKE 'qcache%';
- +-------------------------+---------+
- | Variable_name | Value |
- +-------------------------+---------+
- | Qcache_free_blocks | 1 |
- | Qcache_free_memory | 1031368 | //缓存中的空闲内存
- | Qcache_hits | 0 |
- | Qcache_inserts | 0 |
- | Qcache_lowmem_prunes | 0 |
- | Qcache_not_cached | 100 | //不适合缓存的数量
- | Qcache_queries_in_cache | 0 |
- | Qcache_total_blocks | 1 |
- +-------------------------+---------+
- 8 rows in set (0.00 sec)
步骤五:关于MySQL状态和相关变量的查看
1)查看服务器的相关状态值(运行中动态变化)
使用SHOW GLOBAL STATUS语句,可结合LIKE条件做模糊过滤。
默认有400多个状态值:
- mysql> SHOW GLOBAL STATUSG
- *************************** 1. row ***************************
- Variable_name: Aborted_clients
- Value: 0
- *************************** 2. row ***************************
- Variable_name: Aborted_connects
- Value: 0
- *************************** 3. row ***************************
- Variable_name: Binlog_cache_disk_use
- Value: 0
- *************************** 4. row ***************************
- Variable_name: Binlog_cache_use
- Value: 0
- *************************** 5. row ***************************
- Variable_name: Binlog_stmt_cache_disk_use
- Value: 0
- .. .. //省略中间的大量状态值
- .. ..
- *************************** 435. row ***************************
- Variable_name: Threads_connected
- Value: 1
- *************************** 436. row ***************************
- Variable_name: Threads_created
- Value: 1
- *************************** 437. row ***************************
- Variable_name: Threads_running
- Value: 1
- *************************** 438. row ***************************
- Variable_name: Uptime
- Value: 5322
- *************************** 439. row ***************************
- Variable_name: Uptime_since_flush_status
- Value: 2283
- 439 rows in set (0.00 sec)
2)查看服务器的运行选项(一般为静态限制,可通过my.cnf文件配置,或SET修改)
使用SHOW VARIABLES语句,也可结合LIKE条件做模糊过滤。
默认也有400多个(接近500个)配置选项:
- mysql> SHOW VARIABLESG
- *************************** 1. row ***************************
- Variable_name: auto_increment_increment
- Value: 1
- *************************** 2. row ***************************
- Variable_name: auto_increment_offset
- Value: 1
- *************************** 3. row ***************************
- Variable_name: autocommit
- Value: ON
- *************************** 4. row ***************************
- Variable_name: automatic_sp_privileges
- Value: ON
- *************************** 5. row ***************************
- Variable_name: back_log
- Value: 80
- .. .. //省略中间的大量状态值
- .. ..
- *************************** 486. row ***************************
- Variable_name: version_comment
- Value: MySQL Cluster Community Server (GPL)
- *************************** 487. row ***************************
- Variable_name: version_compile_machine
- Value: x86_64
- *************************** 488. row ***************************
- Variable_name: version_compile_os
- Value: Linux
- *************************** 489. row ***************************
- Variable_name: wait_timeout
- Value: 28800
- *************************** 490. row ***************************
- Variable_name: warning_count
- Value: 0
- 490 rows in set (0.01 sec)