https://www.analyticsvidhya.com/blog/2015/08/comprehensive-guide-regression/
- What is Regression Analysis?
- Why do we use Regression Analysis?
- What are the types of Regressions?
- Linear Regression
- Logistic Regression
- Polynomial Regression
- Stepwise Regression
- Ridge Regression
- Lasso Regression
- ElasticNet Regression
- How to select the right Regression Model?
【发现关系,数据建模和分析的工具】
What is Regression Analysis?
Regression analysis is a form of predictive modelling technique which investigates the relationship between a dependent (target) and independent variable (s) (predictor). This technique is used for forecasting, time series modelling and finding the causal effect relationship between the variables. For example, relationship between rash driving and number of road accidents by a driver is best studied through regression.
There are multiple benefits of using regression analysis. They are as follows:
- It indicates the significant relationships between dependent variable and independent variable.
- It indicates the strength of impact of multiple independent variables on a dependent variable.
【回归技术的选择依据】
There are various kinds of regression techniques available to make predictions. These techniques are mostly driven by three metrics (number of independent variables, type of dependent variables and shape of regression line). We’ll discuss them in detail in the following sections.

0-Linear Regression
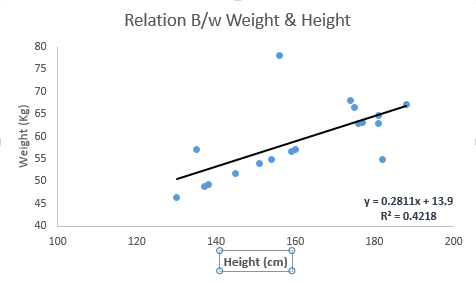
Linear Regression establishes a relationship between dependent variable (Y) and one or more independent variables (X) using a best fit straight line (also known as regression line).
It is represented by an equation Y=a+b*X + e, where a is intercept, b is slope of the line and e is error term. This equation can be used to predict the value of target variable based on given predictor variable(s).
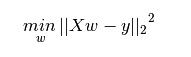
常用的评估线性回归效果的方法:最小二乘法
【降低离群值影响】
Important Points:
- There must be linear relationship between independent and dependent variables
- Multiple regression suffers from multicollinearity, autocorrelation, heteroskedasticity.
- Linear Regression is very sensitive to Outliers. It can terribly affect the regression line and eventually the forecasted values.
- Multicollinearity can increase the variance of the coefficient estimates and make the estimates very sensitive to minor changes in the model. The result is that the coefficient estimates are unstable
- In case of multiple independent variables, we can go with forward selection, backward eliminationand step wise approach for selection of most significant independent variables.
Logistic Regression
【逻辑回归--发现0/1 离散值概率,广泛用于分类问题,其中的工具:取对数】
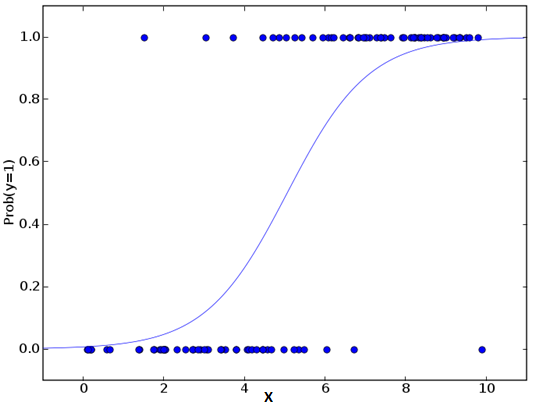
Logistic regression is used to find the probability of event=Success and event=Failure. We should use logistic regression when the dependent variable is binary (0/ 1, True/ False, Yes/ No) in nature. Here the value of Y ranges from 0 to 1 and it can represented by following equation.
odds= p/ (1-p) = probability of event occurrence / probability of not event occurrence
ln(odds) = ln(p/(1-p))
logit(p) = ln(p/(1-p)) = b0+b1X1+b2X2+b3X3....+bkXk


Above, p is the probability of presence of the characteristic of interest. A question that you should ask here is “why have we used log in the equation?”.
Important Points:
- It is widely used for classification problems
- Logistic regression doesn’t require linear relationship between dependent and independent variables. It can handle various types of relationships because it applies a non-linear log transformation to the predicted odds ratio
- To avoid over fitting and under fitting, we should include all significant variables. A good approach to ensure this practice is to use a step wise method to estimate the logistic regression
- It requires large sample sizes because maximum likelihood estimates are less powerful at low sample sizes than ordinary least square
- The independent variables should not be correlated with each other i.e. no multi collinearity. However, we have the options to include interaction effects of categorical variables in the analysis and in the model.
- If the values of dependent variable is ordinal, then it is called as Ordinal logistic regression
- If dependent variable is multi class then it is known as Multinomial Logistic regression.
Polynomial Regression
A regression equation is a polynomial regression equation if the power of independent variable is more than 1. The equation below represents a polynomial equation:
【避免过拟合】
Important Points:
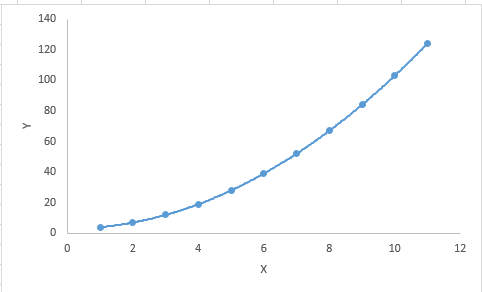
- While there might be a temptation to fit a higher degree polynomial to get lower error, this can result in over-fitting. Always plot the relationships to see the fit and focus on making sure that the curve fits the nature of the problem. Here is an example of how plotting can help:

- Especially look out for curve towards the ends and see whether those shapes and trends make sense. Higher polynomials can end up producing wierd results on extrapolation.
Stepwise Regression
【最小化输入变量规模实现最大化预测能力】
This form of regression is used when we deal with multiple independent variables. In this technique, the selection of independent variables is done with the help of an automatic process, which involves no human intervention.
This feat is achieved by observing statistical values like R-square, t-stats and AIC metric to discern significant variables. Stepwise regression basically fits the regression model by adding/dropping co-variates one at a time based on a specified criterion. Some of the most commonly used Stepwise regression methods are listed below:
- Standard stepwise regression does two things. It adds and removes predictors as needed for each step.
- Forward selection starts with most significant predictor in the model and adds variable for each step.
- Backward elimination starts with all predictors in the model and removes the least significant variable for each step.
Ridge Regression
Ridge Regression is a technique used when the data suffers from multicollinearity ( independent variables are highly correlated). In multicollinearity, even though the least squares estimates (OLS) are unbiased, their variances are large which deviates the observed value far from the true value. By adding a degree of bias to the regression estimates, ridge regression reduces the standard errors.
Above, we saw the equation for linear regression. Remember? It can be represented as:
y=a+ b*x
This equation also has an error term. The complete equation becomes:
y=a+b*x+e (error term), [error term is the value needed to correct for a prediction error between the observed and predicted value]
=> y=a+y= a+ b1x1+ b2x2+....+e, for multiple independent variables.
In a linear equation, prediction errors can be decomposed into two sub components. First is due to the biased and second is due to the variance. Prediction error can occur due to any one of these two or both components. Here, we’ll discuss about the error caused due to variance.
Ridge regression solves the multicollinearity problem through shrinkage parameter λ (lambda). Look at the equation below.
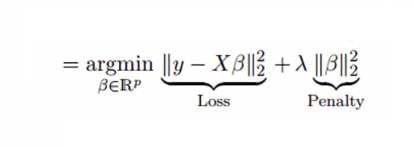
In this equation, we have two components. First one is least square term and other one is lambda of the summation of β2 (beta- square) where β is the coefficient. This is added to least square term in order to shrink the parameter to have a very low variance.
Important Points:
- The assumptions of this regression is same as least squared regression except normality is not to be assumed
- It shrinks the value of coefficients but doesn’t reaches zero, which suggests no feature selection feature
- This is a regularization method and uses l2 regularization.
The aim of this modeling technique is to maximize the prediction power with minimum number of predictor variables. It is one of the method to handle higher dimensionality of data set.
Lasso Regression
【惩罚因子为L1范数而非L2范数】
Similar to Ridge Regression, Lasso (Least Absolute Shrinkage and Selection Operator) also penalizes the absolute size of the regression coefficients. In addition, it is capable of reducing the variability and improving the accuracy of linear regression models. Look at the equation below:
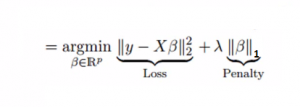
Lasso regression differs from ridge regression in a way that it uses absolute values in the penalty function, instead of squares. This leads to penalizing (or equivalently constraining the sum of the absolute values of the estimates) values which causes some of the parameter estimates to turn out exactly zero. Larger the penalty applied, further the estimates get shrunk towards absolute zero. This results to variable selection out of given n variables.
Important Points:
- The assumptions of this regression is same as least squared regression except normality is not to be assumed
- It shrinks coefficients to zero (exactly zero), which certainly helps in feature selection
- This is a regularization method and uses l1 regularization
- If group of predictors are highly correlated, lasso picks only one of them and shrinks the others to zero
ElasticNet Regression
ElasticNet is hybrid of Lasso and Ridge Regression techniques. It is trained with L1 and L2 prior as regularizer. Elastic-net is useful when there are multiple features which are correlated. Lasso is likely to pick one of these at random, while elastic-net is likely to pick both.

A practical advantage of trading-off between Lasso and Ridge is that, it allows Elastic-Net to inherit some of Ridge’s stability under rotation.
Important Points:
- It encourages group effect in case of highly correlated variables
- There are no limitations on the number of selected variables
- It can suffer with double shrinkage
Beyond these 7 most commonly used regression techniques, you can also look at other models like Bayesian, Ecological and Robust regression.
【高维数据适合高阶方法】
How to select the right regression model?
Life is usually simple, when you know only one or two techniques. One of the training institutes I know of tells their students – if the outcome is continuous – apply linear regression. If it is binary – use logistic regression! However, higher the number of options available at our disposal, more difficult it becomes to choose the right one. A similar case happens with regression models.
Within multiple types of regression models, it is important to choose the best suited technique based on type of independent and dependent variables, dimensionality in the data and other essential characteristics of the data. Below are the key factors that you should practice to select the right regression model:
- Data exploration is an inevitable part of building predictive model. It should be you first step before selecting the right model like identify the relationship and impact of variables
- To compare the goodness of fit for different models, we can analyse different metrics like statistical significance of parameters, R-square, Adjusted r-square, AIC, BIC and error term. Another one is the Mallow’s Cp criterion. This essentially checks for possible bias in your model, by comparing the model with all possible submodels (or a careful selection of them).
- Cross-validation is the best way to evaluate models used for prediction. Here you divide your data set into two group (train and validate). A simple mean squared difference between the observed and predicted values give you a measure for the prediction accuracy.
- If your data set has multiple confounding variables, you should not choose automatic model selection method because you do not want to put these in a model at the same time.
- It’ll also depend on your objective. It can occur that a less powerful model is easy to implement as compared to a highly statistically significant model.
- Regression regularization methods(Lasso, Ridge and ElasticNet) works well in case of high dimensionality and multicollinearity among the variables in the data set.