https://su.baidu.com/helps/index.html#/4/5a61e4b5b34f697f13234a5b
Error524 源站处理超时
更新时间:2018-01-19 20:29:41
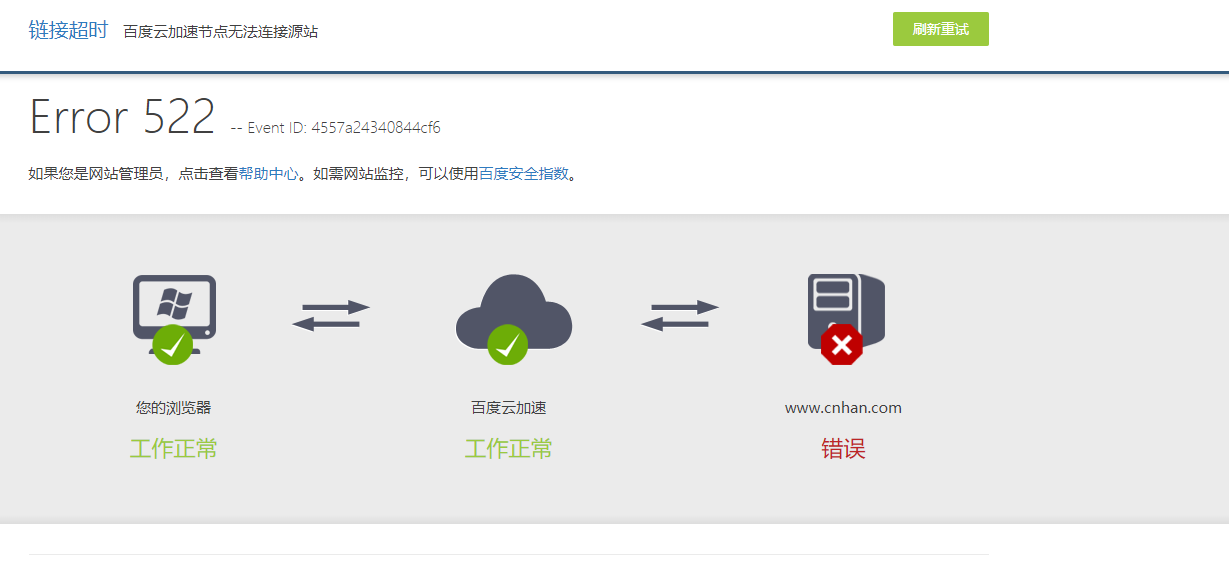
出现524错误,说明我们节点可以连接到源站,但是源站响应请求消耗的时间太长导致超时;这个错误通常是源站运行一个大任务导致的,如php应用程序或数据库查询,这样web服务器必须在任务完成前进行等待。请检查一下您源站的运行情况!
https://support.cloudflare.com/hc/en-us/articles/200171926-Error-524-A-timeout-occurred

Overview
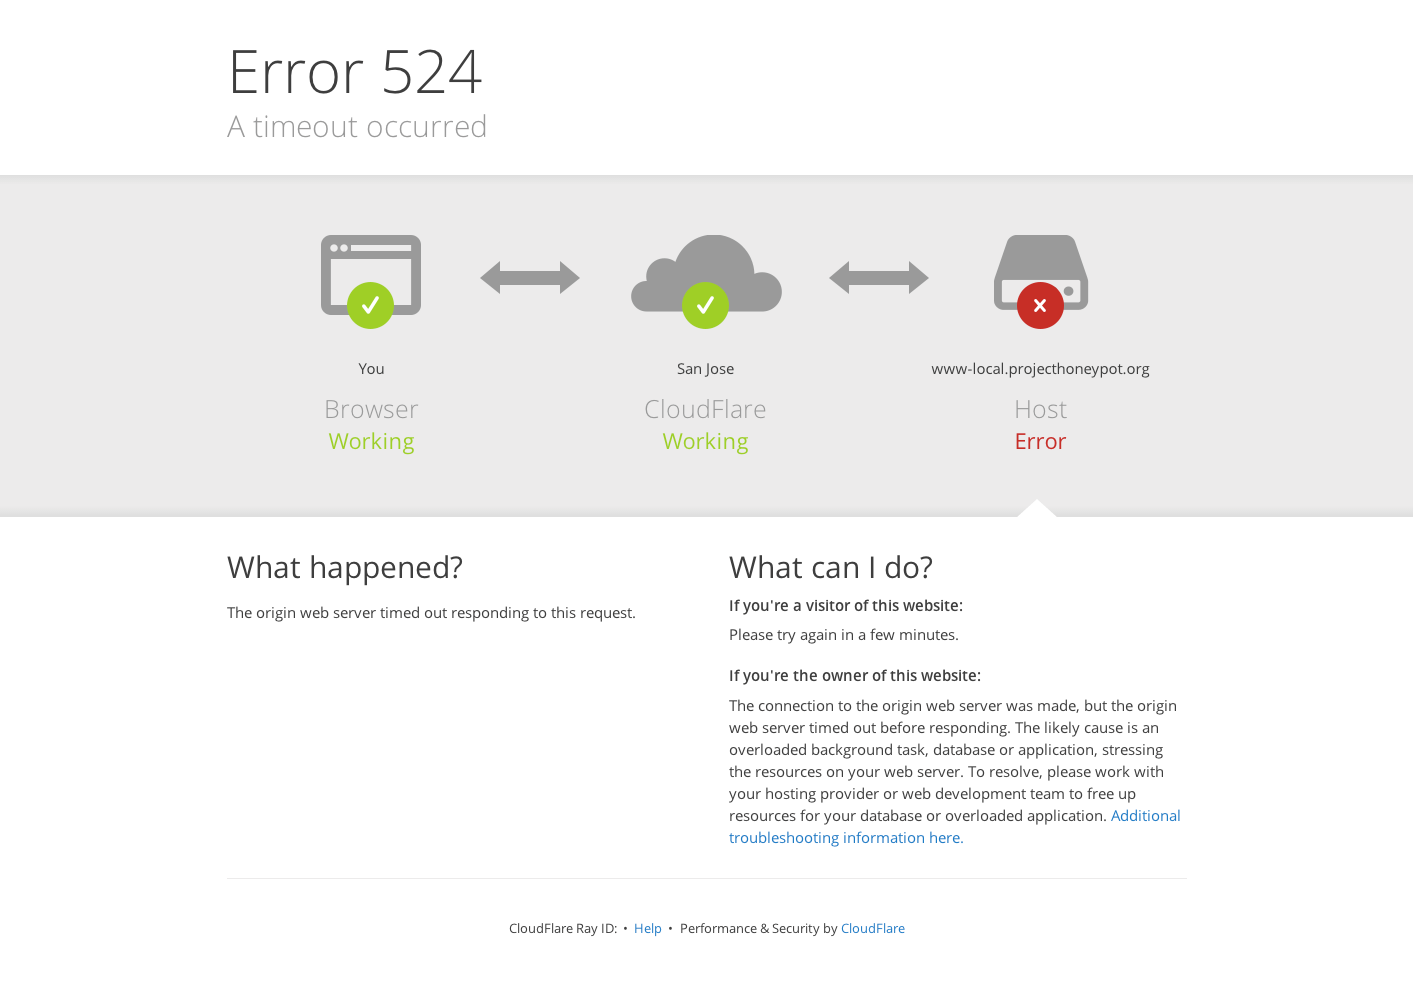
Error 524 error indicates that Cloudflare made a successful TCP connection to the origin web server, but the origin did not reply with an HTTP response before the connection timed out.
Typically, Cloudflare waits 100 seconds for an HTTP response. If the origin doesn't respond in that time, Cloudflare closes the connection and serves Error 524.
Common causes
The most common causes for Error 524 are:
- A long-running process on the origin web server, such as a slow application or database query, for which the web server must wait before it can respond to a request
- An overloaded origin web server
Troubleshoot Error 524
Below, you will find several suggestions for trying to resolve Error 524.
Check origin server resources
Check the origin server's available resources, including CPU and RAM, as well as overall traffic levels. Low memory or a high CPU load could signal a resource problem.
If you're unable to verify these resources on your own, check with your host or a system administrator.
Migrate long-running processes
If you regularly run HTTP requests that take over 100 seconds to complete (for example large data exports), consider moving those long-running processes to a subdomain that is not proxied by Cloudflare. That subdomain would have the orange cloud icon toggled to grey in the Cloudflare DNS Settings. Note that you cannot use a Page Rule to circumvent Error 524.
Adjust Railgun settings
If you use Cloudflare Railgun, Error 524 can also manifest if the time specified by lan.timeout is exceeded. lan.timeout defaults to 30 seconds, so if you're seeing 524 errors with Railgun enabled, try setting this value higher.
Log origin server response time
If you have modify access on the origin web server configuration files, you can log how long the server took to respond to a request by modifying the log format.
Most web servers store the response time as a variable that you can add to your log configuration file.
Apache declares logging format in the LogFormat or CustomLog directives, depending on whether you are making a global change or just for specific virtual hosts.
Response time is stored as the %T variable. See the Apache mod_log_config documentation.
For Nginx, you can modify the log_format directive. Response time is stored as the $request_time variable. See the logging documentation.
Measure response time with cURL
You can use cURL in the Terminal window (on MacOS and Linux) to measure how long a request takes to respond. cURL has a write-out flag which allows you to print specific information about a request using custom variables. See the documentation.
You can use the %{time_connect} and %{time_starttransfer} variables to measure how long it takes to connect to the origin server, as well as the time it takes for the origin to return a response (i.e., time to first byte), using the following command:
curl -vso /dev/null -w "Connect: %{time_connect}
 TTFB: %{time_starttransfer}

Total time: %{time_total}
" http://www.example.com
You can send this request directly to your origin server using the server's IP address and passing a host header:
curl -vso /dev/null -w "Connect: %{time_connect}
 TTFB: %{time_starttransfer}
 Total time: %{time_total}
"
-H ‘Host: www.example.com’ <http://1.2.3.4
At the bottom of the output for these commands, you’ll see three fields, similar to:
Connect: 0.154
TTFB: 1.734
Total time: 1.784
Connect indicates how long it took to establish a TCP connection to the server. This should a relatively low value.
TTFB indicates the time it took to generate a response.
If you see the response taking longer than 100 seconds, you know that it would trigger an Error 524 via Cloudflare.