The Dapr observability building block
Dapr 可观察性构建块
Modern distributed systems are complex. You start with small, loosely coupled, independently deployable services. These services cross process and server boundaries. They then consume different kinds of infrastructure backing services (databases, message brokers, key vaults). Finally, these disparate pieces compose together to form an application.
现代分布式系统非常复杂。从小的,松耦合且可独立部署的服务开始。 这些服务跨进程和服务器边界。 然后,它们使用不同类型的基础设施支持服务 (数据库、消息代理、机密库) 。 最后,这些分散的部分组合在一起构成应用程序。
With so many separate, moving parts, how do you make sense of what is going on? Unfortunately, legacy monitoring approaches from the past aren't enough. Instead, the system must be observable from end-to-end. Modern observability practices provide visibility and insight into the health of the application at all times. They enable you to infer the internal state by observing the output. Observability is mandatory for monitoring and troubleshooting distributed applications.
由于有许多不同的移动部件,您如何了解会发生什么呢? 遗憾的是,过去的旧监视方法还不够。 相反,系统必须是从端到端 可观察 。现代 可观察性 做法可随时了解应用程序的运行状况。 它们允许您通过观察输出来推断内部状态。 可观察性是监视分布式应用程序和排查其问题所必需的。
The system information used to gain observability is referred to as telemetry. It can be divided into four broad categories:
- Distributed tracing provides insight into the traffic between services and services involved in distributed transactions.
- Metrics provides insight into the performance of a service and its resource consumption.
- Logging provides insight into how the code is executing and if errors have occurred.
- Health endpoints provide insight into the availability of a service.
用于获取可观察性的系统信息称为 遥测。 它可以分为四大类:
- 分布式跟踪 提供有关分布式事务中服务之间的通信的深入理解。
- 度量值可让你深入了解服务的性能及其资源使用情况。
- 日志记录可提供代码的执行方式以及错误发生的情况。
- 运行状况终结点可让你深入了解服务的可用性。
The depth of telemetry is determined by the observability features of an application platform. Consider the Azure cloud. It provides a rich telemetry experience that includes all of the telemetry categories. Without any configuration, most Azure IaaS and PaaS services propagate and publish telemetry to the Azure Application Insights service. Application Insights presents system logging, tracing, and problem areas with highly visual dashboards. It can even render a diagram showing the dependencies between services based on their communication.
遥测的深度取决于应用程序平台的可观测性。 请考虑使用 Azure 云。 它提供了丰富的遥测体验,包括所有遥测类别。 如果不进行任何配置,大多数 Azure IaaS 和 PaaS 服务会传播遥测数据到 Azure Application Insights服务 。 Application Insights具有高度可视化仪表板的系统日志记录、跟踪和问题区域。 它甚至可以根据服务的通信呈现服务之间的依赖关系的关系图。
However, what if an application can't use Azure PaaS and IaaS resources? Is it still possible to take advantage of the rich telemetry experience of Application Insights? The answer is yes. A non-Azure application can import libraries, add configuration, and instrument code to emit telemetry to Azure Application Insights. However, this approach tightly couples the application to Application Insights. Moving the app to a different monitoring platform could involve expensive refactoring. Wouldn't it be great to avoid tight coupling and consume observability outside of the code?
但是,如果应用程序无法使用 Azure PaaS 和 IaaS 资源,又如何? 是否仍可以利用Application Insights丰富的遥测数据? 答案为"是"。 非 Azure 应用程序可以导入库、添加配置和检测代码,以将遥测数据发送到Azure Application Insights。 但是,此方式 将使应用程序与Application Insights紧密耦合。 将应用移动到其他监视平台可能涉及成本高昂的重构。 避免紧密耦合和使用代码外部的可观测性不是一个很好的方式吗?
With Dapr, you can. Let's look at how Dapr can add observability to our distributed applications.
使用 Dapr,可以。 让我们看看 Dapr 如何为分布式应用程序添加可观测性。
What it solves
它可解决的问题
The Dapr observability building block decouples observability from the application. It automatically captures traffic generated by Dapr sidecars and Dapr system services that make up the Dapr control plane. The block correlates traffic from a single operation that spans multiple services. It also exposes performance metrics, resource utilization, and the health of the system. Telemetry is published in open-standard formats enabling information to be fed into your monitoring back end of choice. There, the information can be visualized, queried, and analyzed.
Dapr 可观测性构建块将可观测性与应用程序分离。 它自动捕获由 Dapr 边车和 Dapr 系统服务生成的通信,Dapr 系统服务是 Dapr 控制平面的一部分(复制过来的翻译,这样翻译是否正确呢?)。 构建块将跨多个服务的单个操作的流量相关联。 它还公开性能指标、资源利用率和系统的运行状况。 遥测以开放标准格式发布,使信息可以送入你选择的监视后端。 在这里,可以对信息进行可视化、查询和分析。
As Dapr abstracts away the plumbing, the application is unaware of how observability is implemented. There's no need to reference libraries or implement custom instrumentation code. Dapr allows the developer to focus on building business logic and not observability plumbing. Observability is configured at the Dapr level and is consistent across services, even when created by different teams, and built with different technology stacks.
由于 Dapr 抽象掉了该管道,因此如何实现可观察性对应用程序来说是透明的(无需知道的)。 无需引用库或实现自定义检测代码。 Dapr 使开发人员能够专注于构建业务逻辑,而不是可观察性的管道。 可观察性在 Dapr 级别配置,跨服务一致,即使是由不同的团队创建,并使用不同的技术栈构建。
How it works
工作原理
Dapr's sidecar architecture enables built-in observability features. As services communicate, Dapr sidecars intercept the traffic and extract tracing, metrics, and logging information. Telemetry is published in an open standards format. By default, Dapr supports OpenTelemetry and Zipkin.
Dapr 的 边车体系结构 启用内置可观察性功能。 服务通信时,Dapr 边车会截获通信并提取跟踪、指标和日志记录信息。 遥测以开放标准格式发布。 默认情况下,Dapr 支持 OpenTelemetry 和 Zipkin。
Dapr provides collectors that can publish telemetry to different back-end monitoring tools. These tools present Dapr telemetry for analysis and querying. Figure 9-1 shows the Dapr observability architecture:
Dapr 提供可将遥测发布到不同后端监视工具的 收集 器。 这些工具提供了 Dapr 遥测用于分析和查询。 图9-1 显示了 Dapr 可观察性体系结构:
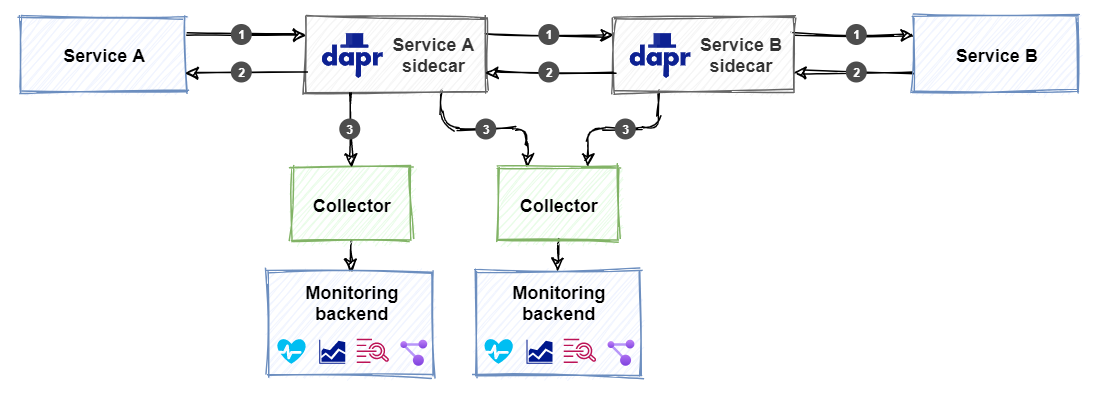
Figure 9-1. Dapr observability architecture.
图 9-1。 Dapr 可观察性体系结构。
- Service A calls an operation on Service B. The call is routed from a Dapr sidecar for Service A to a sidecar for Service B.
- When Service B completes the operation, a response is sent back to Service A through the Dapr sidecars. They gather and publish all available telemetry for every request and response.
- The configured collector ingests the telemetry and sends it to the monitoring back end.
- 服务 A 调用服务 B 上的操作。调用将从服务 A 的 Dapr 边车路由到服务 B 的边车。
- 当服务 B 完成操作时,响应将通过 Dapr 边车发送回服务 A。 它们收集并发布每个请求和响应的所有可用遥测数据。
- 配置的收集器引入遥测数据,并将其发送到监视后端。
As a developer, keep in mind that adding observability is different from configuring other Dapr building blocks, like pub/sub or state management. Instead of referencing a building block, you add a collector and a monitoring back end. Figure 9-1 shows it's possible to configure multiple collectors that integrate with different monitoring back ends.
作为开发人员,请记住,添加可观察性不同于配置其他 Dapr 构建基块,如发布/订阅或状态管理。 添加收集器和监视后端,而不是引用构建基块。 图 9-1 显示可以配置与不同监视后端相集成的多个收集器。
At the beginning of this chapter, four categories of telemetry were identified. The following sections will provide detail for each category. They'll include instruction on how to configure collectors that integrate with popular monitoring back ends.
在本章开始时,标识了四种类别的遥测数据。 以下部分将提供每个类别的详细信息。 其中将指导如何配置收集器与常用监视后端相集成。
Distributed tracing
分布式跟踪
Distributed tracing provides insight into the traffic that flows across services in a distributed application. The log of exchanged request and response messages is an invaluable source of information for troubleshooting issues. The hard part is correlating messages that originate from the same operation.
分布式跟踪提供对在分布式应用程序中跨服务通信流动的洞悉。 交换请求和响应消息的日志是排除故障问题的宝贵信息来源。 困难的是源自同 一操作的关联消息。
Dapr uses the W3C Trace Context to correlate related messages. It injects the same context information into requests and responses that form a unique operation. Figure 9-2 shows how correlation works:
Dapr 使用 W3C 跟踪上下文 来关联相关消息。 它将相同的上下文信息注入到构成唯一操作的请求和响应中。 图 9-2 显示了相关性的工作原理:
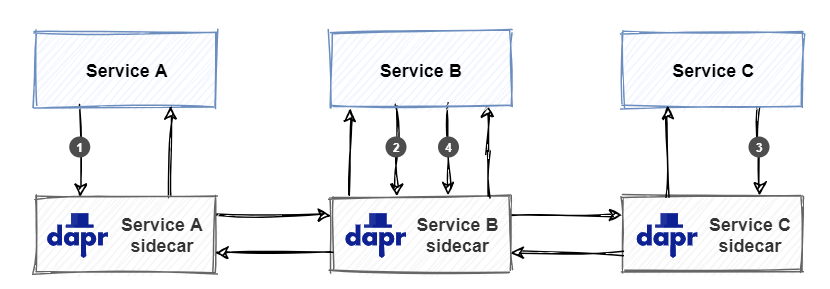
Figure 9-2. W3C Trace Context example.
图 9-2。 W3C 跟踪上下文示例。
- Service A invokes an operation on Service B. As Service A starts the call, Dapr creates a unique trace context and injects it into the request.
- Service B receives the request and invokes an operation on Service C. Dapr detects that the incoming request contains a trace context and propagates it by injecting it into the outgoing request to Service C.
- Service C receives the request and handles it. Dapr detects that the incoming request contains a trace context and propagates it by injecting it into the outgoing response back to Service B.
- Service B receives the response and handles it. It then creates a new response and propagates the trace context by injecting it into the outgoing response back to Service A.
- 服务 A 调用服务 B 上的操作。当服务 A 开始调用时,Dapr 会创建唯一的跟踪上下文,并注入到请求中。
- 服务 B 接收请求并调用服务 C 上的操作。Dapr 检测到传入请求包含跟踪上下文,并传播该上下文(通过将上下文注入到传出请求(到服务C)中)。
- 服务 C 接收并处理请求。 Dapr 检测到传入请求包含跟踪上下文,并传播该上下文(通过将上下文注入到传出响应(返回到服务B)中)。
- 服务 B 接收并处理响应。 然后,它会创建一个新响应,通过将跟踪上下文注入到传出响应中,将跟踪上下文传播回服务 A。
A set of requests and responses that belong together is called a trace. Figure 9-3 shows a trace:
一次会话中的一系列请求和响应 称为跟踪。 图9-3 显示了一个跟踪:

Figure 9-3. Traces and spans.
图 9-3。 跟踪和范围(跨越)。
In the figure, note how the trace represents a unique application transaction that takes place across many services. A trace is a collection of spans. Each span represents a single operation or unit of work done within the trace. Spans are the requests and responses that are sent between services that implement the unique transaction.
在图中,请注意跟踪如何表示在多个服务之间发生的唯一应用程序事务。 跟踪是范围(跨越)的集合。 每个范围(跨越)都代表跟踪内完成的单个操作或工作单元。 范围(跨越)是在实现唯一事务的服务之间发送的请求和响应。
The next sections discuss how to inspect tracing telemetry by publishing it to a monitoring back end.
后续部分讨论如何通过将跟踪遥测数据发布到监视后端来实现监测。
Use a Zipkin monitoring back end
使用 Zipkin 监视后端
Zipkin is an open-source distributed tracing system. It can ingest and visualize telemetry data. Dapr offers default support for Zipkin. The following example demonstrates how to configure Zipkin to visualize Dapr telemetry.
Zipkin 是开源分布式跟踪系统。 它可以摄取和可视化遥测数据。 Dapr 提供对 Zipkin 的默认支持。 下面的示例演示如何将 Zipkin 配置为Dapr 可视化遥测。
Enable and configure tracing
启用和配置跟踪
To start, tracing must be enabled for the Dapr runtime using a Dapr configuration file. Here's an example of a configuration file named tracing-config.yaml:
首先,必须通过修改 Dapr 配置文件为 Dapr 运行时启用跟踪。 下面是名为 tracing-config.yaml 的配置文件的示例:
apiVersion: dapr.io/v1alpha1
kind: Configuration
metadata:
  name: tracing-config
  namespace: default
spec:
  tracing:
    samplingRate: "1"
    zipkin:
      endpointAddress: "http://zipkin.default.svc.cluster.local:9411/api/v2/spans"
The samplingRate attribute specifies the interval used for publishing traces. The value must be between 0 (tracing disabled) and 1 (every trace is published). With a value of 0.5, for example, every other trace is published, significantly reducing published traffic. The endpointAddress points to an endpoint on a Zipkin server running in a Kubernetes cluster. The default port for Zipkin is 9411. The configuration must be applied to the Kubernetes cluster using the Kubernetes CLI:
samplingRate属性指定用于发布跟踪的时间间隔。 该值必须介于 0 (禁用跟踪) 并 1 (发布每个跟踪) 。 例如,如果值为 0.5 ,每隔一个跟踪会被发布,大大减少发布的流量。 endpointAddress 指向在Kubernetes 群集中运行的 Zipkin 服务上的终结点。 Zipkin 的默认端口为 9411 。 必须使用 Kubernetes CLI 将配置应用于 Kubernetes 集群:
kubectl apply -f tracing-config.yaml
Install the Zipkin server
安装 Zipkin 服务
When installing Dapr in self-hosted mode, a Zipkin server is automatically installed and tracing is enabled in the default configuration file located in $HOME/.dapr/config.yaml or %USERPROFILE%.daprconfig.yaml on Windows.
在自承载模式下安装 Dapr 时,会自动安装 Zipkin 服务,并且会在位于 Windows的$HOME/.dapr/config.yaml或 %USERPROFILE%.daprconfig.yaml默认配置文件中启用跟踪。
When installing Dapr on a Kubernetes cluster though, Zipkin isn't added by default. The following Kubernetes manifest file named zipkin.yaml, deploys a standard Zipkin server to the cluster:
但是,在 Kubernetes 群集上安装 Dapr 时,默认情况下不会添加 Zipkin。 以下名为 zipkin.yaml 的 Kubernetes 清单文件将标准 Zipkin 服务部署到群集:
kind: Deployment
apiVersion: apps/v1
metadata:
  name: zipkin
  namespace: eshop
  labels:
    service: zipkin
spec:
  replicas: 1
  selector:
    matchLabels:
      service: zipkin
  template:
    metadata:
      labels:
        service: zipkin
    spec:
      containers:
        - name: zipkin
          image: openzipkin/zipkin-slim
          imagePullPolicy: IfNotPresent
          ports:
            - name: http
              containerPort: 9411
              protocol: TCP

---

kind: Service
apiVersion: v1
metadata:
  name: zipkin
  namespace: eshop
  labels:
    service: zipkin
spec:
  type: NodePort
  ports:
    - port: 9411
      targetPort: 9411
      nodePort: 32411
      protocol: TCP
      name: zipkin
  selector:
    service: zipkin
The deployment uses the standard openzipkin/zipkin-slim container image. The Zipkin service exposes the Zipkin web front end, which you can use to view the telemetry on port 32411. Use the Kubernetes CLI to apply the Zipkin manifest file to the Kubernetes cluster and deploy the Zipkin server:
部署使用标准 openzipkin/zipkin-slim 容器镜像。 Zipkin 服务公开 Zipkin Web 前端,可用于在32411 端口上查看遥测数据。 使用 Kubernetes CLI 将 Zipkin 清单文件应用到 Kubernetes 群集并部署 Zipkin 服务:
kubectl apply -f zipkin.yaml
Configure the services to use the tracing configuration
将服务配置为使用跟踪配置
Now everything is set up correctly to start publishing telemetry. Every Dapr sidecar that is deployed as part of the application must be instructed to emit telemetry when started. To do that, add a dapr.io/config annotation that references the tracing-config configuration to the deployment of each service. Here's an example of the eShop ordering API service's manifest file containing the annotation:
现在,所有内容已正确设置,可开始发布遥测数据。 必须指示作为应用程序一部分部署的每一个 Dapr sidecar 在启动时发射遥测数据。 为此,请添加一个 dapr.io/config 注解,该注解为每个服务的部署引用tracing-config配置。 下面是包含注解的 eShop 订购 API 服务的清单文件示例:
apiVersion: apps/v1
kind: Deployment
metadata:
  name: ordering-api
  namespace: eshop
  labels:
    app: eshop
spec:
  replicas: 1
  selector:
    matchLabels:
      app: eshop
  template:
    metadata:
      labels:
        app: simulation
      annotations:
        dapr.io/enabled: "true"
        dapr.io/app-id: "ordering-api"
        dapr.io/config: "tracing-config"
    spec:
      containers:
      - name: simulation
        image: eshop/ordering.api:linux-latest
Inspect the telemetry in Zipkin
检查 Zipkin 中的遥测数据
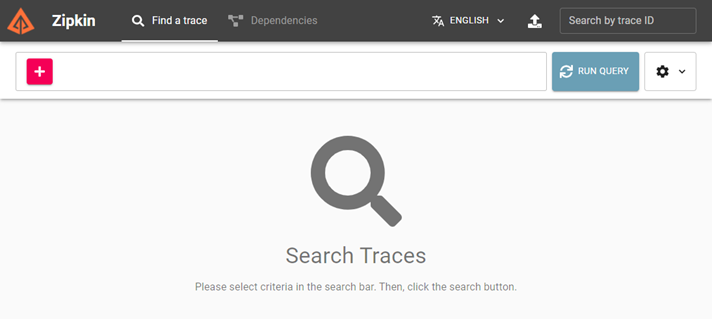
Once the application is started, the Dapr sidecars will emit telemetry to the Zipkin server. To inspect this telemetry, point a web-browser to http://localhost:32411. You'll see the Zipkin web front end:
应用程序启动后,Dapr 边车 会向 Zipkin 服务发射遥测数据。 若要检查此遥测,请在 Web 浏览器中打开 http://localhost:32411 。 你将看到 Zipkin Web 前端:
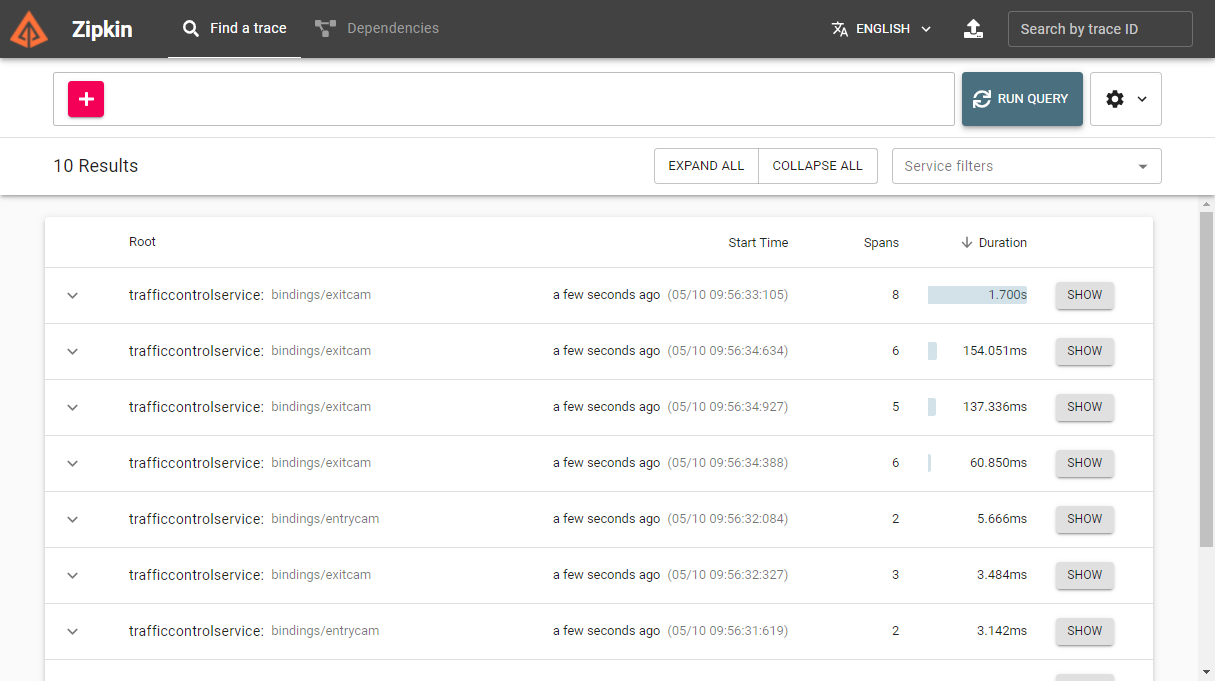
On the Find a trace tab, you can query traces. Pressing the RUN QUERY button without specifying any restrictions will show all the ingested traces:、
在 "查找跟踪" 选项卡上,可以查询跟踪。 点击 " 运行查询 " 按钮而不指定任何条件将显示所有引入 跟踪:
licking the SHOW button next to a specific trace, will show the details of that trace:
单击某个跟踪旁边的 " 显示 " 按钮将显示该跟踪的详细信息:
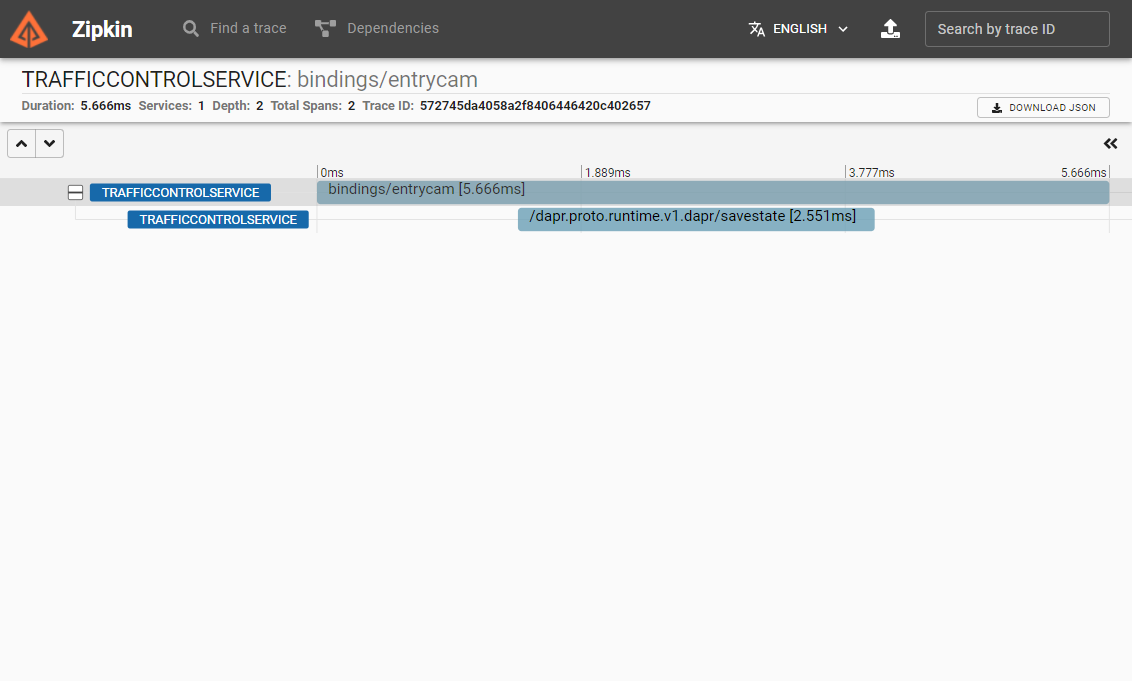
Each item on the details page, is a span that represents a request that is part of the selected trace.
详细信息页上的每一项都是一个范围(跨越),该范围(跨越)表示作为所选跟踪的一部分的请求。
Inspect the dependencies between services
检查服务之间的依赖关系
Because Dapr sidecars handle traffic between services, Zipkin can use the trace information to determine the dependencies between the services. To see it in action, go to the Dependencies tab on the Zipkin web page and select the button with the magnifying glass. Zipkin will show an overview of the services and their dependencies:
由于 Dapr 边车处理服务之间的通信,因此 Zipkin 可以使用跟踪信息来确定服务之间的依赖关系。 若要查看其工作方式,请在 Zipkin 网页上,单击 " 依赖项 " 选项卡,然后选择带有放大镜的按钮。 Zipkin 将显示服务及其依赖项的概述:
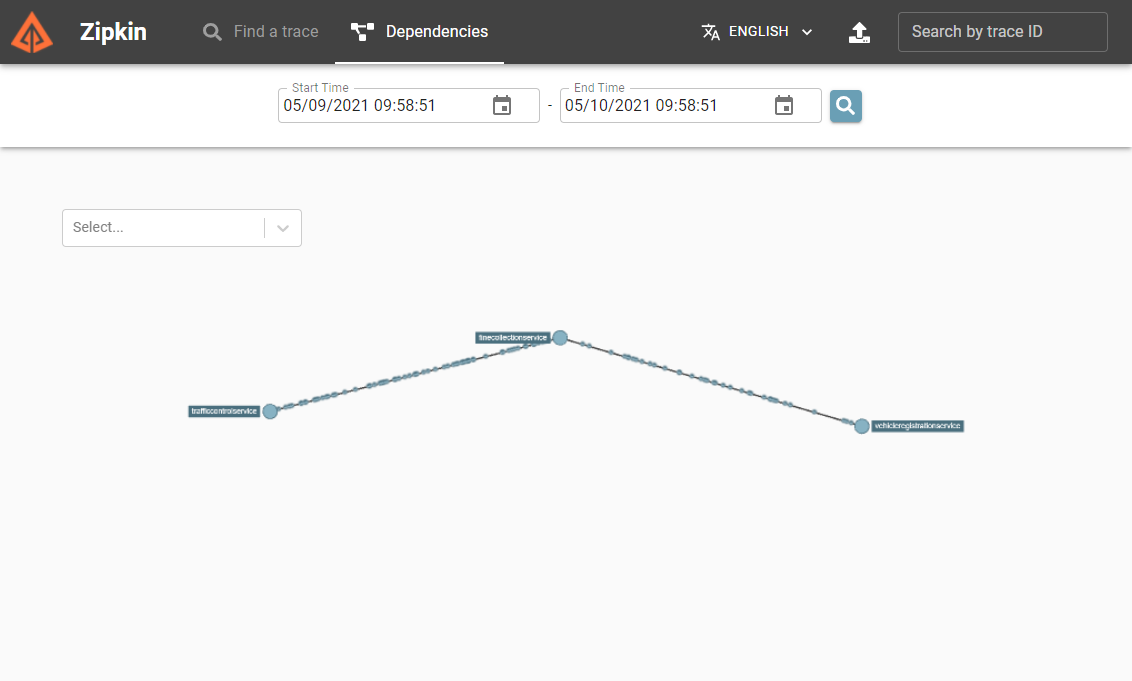
The animated dots on the lines between the services represent requests and move from source to destination. Red dots indicate a failed request.
服务之间的线条上的动画点表示请求,并从源移动到目标。 红点表示失败的请求。
Use a Jaeger or New Relic monitoring back end
使用 Jaeger 或 New Relic 监视后端
Beyond Zipkin itself, other monitoring back-end software also supports ingesting telemetry using the Zipkin format. Jaeger is an open source tracing system created by Uber Technologies. It's used to trace transactions between distributed services and troubleshoot complex microservices environments. New Relic is a full-stack observability platform. It links relevant data from a distributed application to provide a complete picture of your system. To try them out, specify an endpointAddress pointing to either a Jaeger or New Relic server in the Dapr configuration file. Here's an example of a configuration file that configures Dapr to send telemetry to a Jaeger server. The URL for Jaeger is identical to the URL for the Zipkin. The only difference is the port on which the server runs:
除了 Zipkin 本身以外,其他监视后端软件也支持使用 Zipkin 格式的引入遥测。 Jaeger 是由 Uber 技术创建的开源跟踪系统。 它用于跟踪分布式服务之间的事务,并对复杂的微服务环境进行故障排除。 New Relic 是一个 全栈 可观察性平台。 它链接分布式应用程序中的相关数据,以提供完整的系统画面。 若要试用,请在 Dapr 配置文件中指定 endpointAddress 指向 Jaeger 或New Relic 服务的。 下面是配置文件的一个示例,它将 Dapr 配置为将遥测数据发送到 Jaeger 服务。 Jaeger 的 URL 与 Zipkin 的 URL 相同。 唯一的区别是运行服务的端口:
apiVersion: dapr.io/v1alpha1
kind: Configuration
metadata:
  name: tracing-config
  namespace: default
spec:
  tracing:
    samplingRate: "1"
    zipkin:
      endpointAddress: "http://localhost:9415/api/v2/spans"
To try out New Relic, specify the endpoint of the New Relic API. Here's an example of a configuration file for New Relic:
若要试用New Relic,请指定 New Relic API 的终结点。 下面是适用于New Relic的配置文件示例:
apiVersion: dapr.io/v1alpha1
kind: Configuration
metadata:
  name: tracing-config
  namespace: default
spec:
  tracing:
    samplingRate: "1"
    zipkin:
      endpointAddress: "https://trace-api.newrelic.com/trace/v1?Api-Key=<NR-API-KEY>&Data-Format=zipkin&Data-Format-Version=2"
Check out the Jaeger and New Relic websites for more information on how to use them.
请查看 Jaeger 和 New Relic 网站,详细了解如何使用它们。
Metrics
衡量指标
Metrics provide insight into performance and resource consumption. Under the hood, Dapr emits a wide collection of system and runtime metrics. Dapr uses Prometheus as a metric standard. Dapr sidecars and system services, expose a metrics endpoint on port 9090. A Prometheus scraper calls this endpoint at a predefined interval to collect metrics. The scraper sends metric values to a monitoring back end. Figure 9-4 shows the scraping process:
指标提供性能和资源消耗的洞见。 在底层,Dapr 发出广泛的系统指标和运行时指标集合。 Dapr 使用 Prometheus 作为指标标准。 Dapr 边车和系统服务在 9090 端口 上公开指标终结点。 Prometheus 抓取器 以预定义的间隔调用此终结点以收集指标。 抓取器将指标值发送到监视后端。 图 9-4 显示了抓取过程:
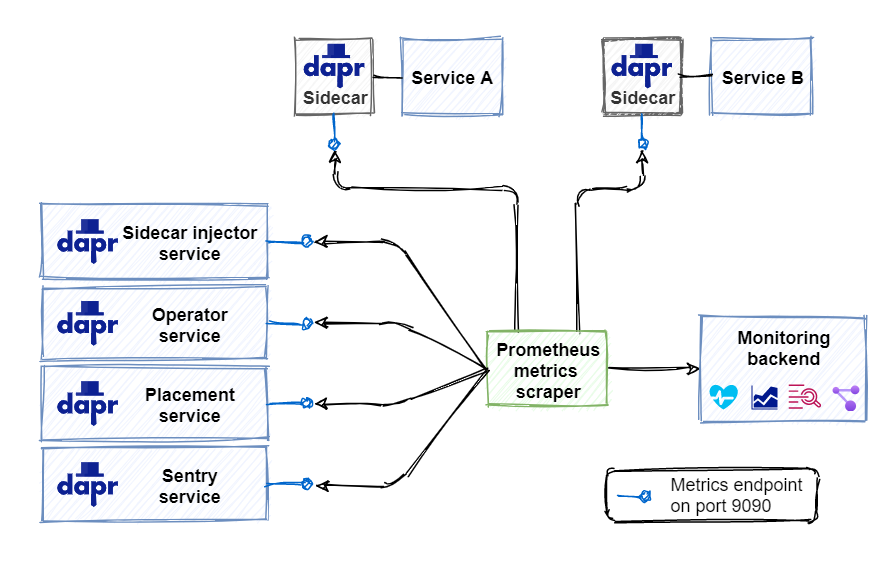
Figure 9-4. Scraping Prometheus metrics.
图 9-4。 抓取 Prometheus 指标。
In the above figure, each sidecar and system service exposes a metric endpoint that listens on port 9090. The Prometheus Metrics Scrapper captures metrics from each endpoint and published the information to the monitoring back end.
在上图中,每个边车和系统服务都公开一个侦听9090 端口的指标终结点。 Prometheus 指标抓取器从每个终结点捕获指标,将信息发布到监视后端。
Service discovery
服务发现
You might wonder how the metrics scraper knows where to collect metrics. Prometheus can integrate with discovery mechanisms built into target deployment environments. For example, when running in Kubernetes, Prometheus can integrate with the Kubernetes API to find all available Kubernetes resources running in the environment.
你可能想知道指标抓取器如何知道在何处收集指标。 Prometheus 可以与目标部署环境中内置的发现机制集成。 例如,在 Kubernetes 中运行时,Prometheus 可以与 Kubernetes API 集成,以查找环境中运行的所有可用的 Kubernetes 资源。
Metrics list
指标列表
Dapr generates a large set of metrics for Dapr system services and its runtime. Some examples include:
Dapr 为 Dapr 系统服务及其运行时生成大量指标。 示例包括:
| Metric | Source | Description |
|---|---|---|
| dapr_operator_service_created_total | System | The total number of Dapr services created by the Dapr Operator service. |
| dapr_injector_sidecar_injection/requests_total | System | The total number of sidecar injection requests received by the Dapr Sidecar-Injector service. |
| dapr_placement_runtimes_total | System | The total number of hosts reported to the Dapr Placement service. |
| dapr_sentry_cert_sign_request_received_total | System | The number of certificate signing requests (CRSs) received by the Dapr Sentry service. |
| dapr_runtime_component_loaded | Runtime | The number of successfully loaded Dapr components. |
| dapr_grpc_io_server_completed_rpcs | Runtime | Count of gRPC calls by method and status. |
| dapr_http_server_request_count | Runtime | Number of HTTP requests started in an HTTP server. |
| dapr_http/client/sent_bytes | Runtime | Total bytes sent in request body (not including headers) by an HTTP client. |
| 指标 | 源 | 说明 |
|---|---|---|
| dapr_operator_service_created_total | 系统 | Dapr Operator 服务创建的 Dapr 服务总数。 |
| dapr_injector_sidecar_injection/requests_total | 系统 | Dapr Sidecar-Injector 服务收到的边车注入请求总数。 |
| dapr_placement_runtimes_total | 系统 | 向 Dapr Placement服务报告的主机总数。 |
| dapr_sentry_cert_sign_request_received_total | 系统 | Dapr Sentry 服务收到的证书签名请求数。 |
| dapr_runtime_component_loaded | 运行时 | 已成功加载的 Dapr 组件数。 |
| dapr_grpc_io_server_completed_rpcs | 运行时 | 由方法和状态的 gRPC 调用的计数。 |
| dapr_http_server_request_count | 运行时 | HTTP 服务器中启动的 HTTP 请求数。 |
| dapr_http/client/sent_bytes | 运行时 | 由Http 客户端请求正文中发送的总字节数 (不包括标头)。 |
For more information on available metrics, see the Dapr metrics documentation.
有关可用指标的详细信息,请参阅 Dapr 指标文档。
Configure Dapr metrics
配置 Dapr 指标
At runtime, you can disable the metrics collection endpoint by including the --enable-metrics=false argument in the Dapr command. Or, you can also change the default port for the endpoint with the --metrics-port 9090 argument.
在运行时,可以通过在 Dapr 命令中包含--enable-metrics=false 参数来禁用指标收集终结点。 或者,还可以使用 --metrics-port 9090 参数来更改终结点的默认端口。
You can also use a Dapr configuration file to statically enable or disable runtime metrics collection:
还可以使用 Dapr 配置文件来静态地启用或禁用运行时指标收集:
apiVersion: dapr.io/v1alpha1
kind: Configuration
metadata:
  name: dapr-config
  namespace: eshop
spec:
  tracing:
    samplingRate: "1"
  metric:
    enabled: false
Visualize Dapr metrics
可视化 Dapr 指标
With the Prometheus scraper collecting and publishing metrics into the monitoring back end, how do you make sense of the raw data? A popular visualization tool for analyzing metrics is Grafana. With Grafana, you can create dashboards from the available metrics. Here's an example of a dashboard displaying Dapr system services metrics:
通过 Prometheus 抓取器收集指标并将其发布到监视后端,你如何理解原始数据? 用于分析指标的常用可视化工具是 Grafana。 使用 Grafana 可以从可用指标创建仪表板。 下面是一个显示 Dapr 系统服务指标的仪表板示例:

The Dapr documentation includes a tutorial for installing Prometheus and Grafana.
Dapr 文档包含 用于安装 Prometheus 和 Grafana 的教程。
Logging
日志记录
Logging provides insight into what is happening with a service at runtime. When running an application, Dapr automatically emits log entries from Dapr sidecars and Dapr system services. However, logging entries instrumented in your application code aren't automatically included. To emit logging from application code, you can import a specific SDK like OpenTelemetry SDK for .NET. Logging application code is covered later in this chapter in the section Using the Dapr .NET SDK.
日志记录提供了服务运行时发生了什么。 运行应用程序时,Dapr 会自动从 Dapr 边车和 Dapr 系统服务发出日志条目。 但是,在应用程序代码中检测到的日志记录项不会自动包括在内。 若要从应用程序代码发出日志记录,可以导入特定 SDK,如 OPENTELEMETRY sdk for .net。 记录日志的应用代码将在本章后面的 使用 Dapr .NET SDK 部分中介绍。
Log entry structure
日志条目结构
Dapr emits structured logging. Each log entry has the following format:
Dapr 发出结构化日志记录。 每个日志条目都具有以下格式:
| Field | Description | Example |
|---|---|---|
| time | ISO8601 formatted timestamp | 2021-01-10T14:19:31.000Z |
| level | Level of the entry (debug | info | warn | error) |
info |
| type | Log Type | log |
| msg | Log Message | metrics server started on :62408/ |
| scope | Logging Scope | dapr.runtime |
| instance | Hostname where Dapr runs | TSTSRV01 |
| app_id | Dapr App ID | ordering-api |
| ver | Dapr Runtime Version | 1.0.0-rc.2 |
| 字段 | 说明 | 示例 |
|---|---|---|
| time | ISO8601 格式的时间戳 | 2021-01-10T14:19:31.000Z |
| level | 条目级别 (debug | info | warn | error) |
info |
| type | 日志类型 | log |
| msg | 日志消息 | metrics server started on :62408/ |
| scope | 日志记录范围 | dapr.runtime |
| instance | Dapr 运行位置的主机名 | TSTSRV01 |
| app_id | Dapr 应用 ID | ordering-api |
| ver | Dapr 运行时版本 | 1.0.0-rc.2 |
When searching through logging entries in a troubleshooting scenario, the time and level fields are especially helpful. The time field orders log entries so that you can pinpoint specific time periods. When troubleshooting, log entries at the debug level provide more information on the behavior of the code.
在故障排除方案中搜索日志记录条目时,time 和 level 字段尤其有用。 time字段对日志条目进行排序,以便可以明确指出特定的时间段。 进行故障排除时,dubug级别的日志 条目 提供有关代码行为的详细信息。
Plain text versus JSON format
纯文本与 JSON 格式
By default, Dapr emits structured logging in plain-text format. Every log entry is formatted as a string containing key/value pairs. Here's an example of logging in plain text:
== DAPR == time="2021-01-12T16:11:39.4669323+01:00" level=info msg="starting Dapr Runtime -- version 1.0.0-rc.2 -- commit 196483d" app_id=ordering-api instance=TSTSRV03 scope=dapr.runtime type=log ver=1.0.0-rc.2
== DAPR == time="2021-01-12T16:11:39.467933+01:00" level=info msg="log level set to: info" app_id=ordering-api instance=TSTSRV03 scope=dapr.runtime type=log ver=1.0.0-rc.2
== DAPR == time="2021-01-12T16:11:39.467933+01:00" level=info msg="metrics server started on :62408/" app_id=ordering-api instance=TSTSRV03 scope=dapr.metrics type=log ver=1.0.0-rc.2
While simple, this format is difficult to parse. If viewing log entries with a monitoring tool, you'll want to enable JSON formatted logging. With JSON entries, a monitoring tool can index and query individual fields. Here's the same log entries in JSON format:
虽然简单,但此格式难以进行语法分析。 如果使用监视工具查看日志条目,需要启用 JSON 格式的日志记录。 使用 JSON 条目,监视工具可以检索和查询个别字段。 下面是 JSON 格式的相同日志条目:
{"app_id": "ordering-api", "instance": "TSTSRV03", "level": "info", "msg": "starting Dapr Runtime -- version 1.0.0-rc.2 -- commit 196483d", "scope": "dapr.runtime", "time": "2021-01-12T16:11:39.4669323+01:00", "type": "log", "ver": "1.0.0-rc.2"}
{"app_id": "ordering-api", "instance": "TSTSRV03", "level": "info", "msg": "log level set to: info", "scope": "dapr.runtime", "type": "log", "time": "2021-01-12T16:11:39.467933+01:00", "ver": "1.0.0-rc.2"}
{"app_id": "ordering-api", "instance": "TSTSRV03", "level": "info", "msg": "metrics server started on :62408/", "scope": "dapr.metrics", "type": "log", "time": "2021-01-12T16:11:39.467933+01:00", "ver": "1.0.0-rc.2"}
To enable JSON formatting, you need to configure each Dapr sidecar. In self-hosted mode, you can specify the flag --log-as-json on the command line:
若要启用 JSON 格式设置,需要配置每个 Dapr 边车。 在自承载模式下,可以在命令行上指定 --log-as-json 标志:
dapr run --app-id ordering-api --log-level info --log-as-json dotnet run
In Kubernetes, you can add a dapr.io/log-as-json annotation to each deployment for the application:
在 Kubernetes 中,可以将 dapr.io/log-as-json 注解添加到应用程序的每个部署:
annotations:
   dapr.io/enabled: "true"
   dapr.io/app-id: "ordering-api"
   dapr.io/app-port: "80"
   dapr.io/config: "dapr-config"
   dapr.io/log-as-json: "true"
When you install Dapr in a Kubernetes cluster using Helm, you can enable JSON formatted logging for all the Dapr system services:
使用 Helm 在 Kubernetes 群集中安装 Dapr 时,可以针对所有 Dapr 系统服务启用 JSON 格式的日志记录:
helm repo add dapr https://dapr.github.io/helm-charts/
helm repo update
kubectl create namespace dapr-system
helm install dapr dapr/dapr --namespace dapr-system --set global.logAsJson=true
Collect logs
收集日志
The logs emitted by Dapr can be fed into a monitoring back end for analysis. A log collector is a component that collects logs from a system and sends them to a monitoring back end. A popular log collector is Fluentd. Check out the How-To: Set up Fluentd, Elastic search and Kibana in Kubernetes in the Dapr documentation. This article contains instructions for setting up Fluentd as log collector and the ELK Stack (Elastic Search and Kibana) as a monitoring back end.
Dapr 发出的日志可以馈入监视后端进行分析。 日志收集器是一个组件,用于从系统收集日志并将其发送到监视后端。 常用日志收集器是 Fluentd。 请参阅 Dapr文档中的如何:在 Kubernetes 中设置 Fluentd、Elastic search和 Kibana。 本文包含有关将 Fluentd 设置为日志收集器和 ELK Stack (Elastic Search and Kibana) 作为监视后端的说明。
Health status
运行状况
The health status of a service provides insight into its availability. Each Dapr sidecar exposes a health API that can be used by the hosting environment to determine the health of the sidecar. The API has one operation:
服务的运行状况提供其可用性的洞见。 每个 Dapr sidecar 都公开一个运行状况 API,宿主环境可以使用该 API 来确定 边车的运行状况。 API 有一个操作:
GET http://localhost:3500/v1.0/healthz
The operation returns two HTTP status codes:
- 204: When the sidecar is healthy
- 500: when the sidecar isn't healthy
该操作返回两个 HTTP 状态码:
- 204:边车运行正常时
- 500:边车运行不正常时
When running in self-hosted mode, the health API isn't automatically invoked. You can invoke the API though from application code or a health monitoring tool.
在自承载模式下运行时,不会自动调用运行状况 API。 不过,可以从应用程序代码或运行状况监视工具调用 API。
When running in Kubernetes, the Dapr sidecar-injector automatically configures Kubernetes to use the health API for executing liveness probes and readiness probes.
在 Kubernetes 中运行时,Dapr sidecar-injector 会自动将 Kubernetes 配置为使用运行状况 API 执行存活探测 和 就绪探测。
Kubernetes uses liveness probes to determine whether a container is up and running. If a liveness probe returns a failure code, Kubernetes will assume the container is dead and automatically restart it. This feature increases the overall availability of your application.
Kubernetes 使用存活探测来确定容器是否已启动并正在运行。 如果存活探测返回失败代码,Kubernetes 将假定容器已死并自动重启。 此功能可提高应用程序的整体可用性。
Kubernetes uses readiness probes to determine whether a container is ready to start accepting traffic. A pod is considered ready when all of its containers are ready. Readiness determines whether a Kubernetes service can direct traffic to a pod in a load-balancing scenario. Pods that aren't ready are automatically removed from the load-balancer.
Kubernetes 使用就绪探测来确定容器是否已准备好通信。 当 Pod 的所有容器都准备就绪时,它被视为已就绪。 就绪探测确定 Kubernetes 服务是否可以与负载平衡方案中的 pod通信。 未准备就绪的 pod 会自动从负载平衡器中删除。
Liveness and readiness probes have several configurable parameters. Both are configured in the container spec section of a pod's manifest file. By default, Dapr uses the following configuration for each sidecar container:
存活和就绪探测具有多个可配置参数。 这两者都在 pod 的清单文件的 "容器规范" 部分中进行配置。 默认情况下,Dapr 对每个边车容器使用以下配置:
livenessProbe:
      httpGet:
        path: v1.0/healthz
        port: 3500
      initialDelaySeconds: 5
      periodSeconds: 10
      timeoutSeconds : 5
      failureThreshold : 3
readinessProbe:
      httpGet:
        path: v1.0/healthz
        port: 3500
      initialDelaySeconds: 5
      periodSeconds: 10
      timeoutSeconds : 5
      failureThreshold: 3
The following parameters are available for the probes:
- The
pathspecifies the Dapr health API endpoint. - The
portspecifies the Dapr health API port. - The
initialDelaySecondsspecifies the number of seconds Kubernetes will wait before it starts probing a container for the first time. - The
periodSecondsspecifies the number of seconds Kubernetes will wait between each probe. - The
timeoutSecondsspecifies the number of seconds Kubernetes will wait on a response from the API before timing out. A timeout is interpreted as a failure. - The
failureThresholdspecifies the number of failed status code Kubernetes will accept before considering the container not alive or not ready.
以下参数可用于探测:
path指定 Dapr HEALTH API 终结点。port指定 Dapr HEALTH API 端口。initialDelaySeconds指定 Kubernetes 第一次开始探测容器前等待的秒数。periodSeconds指定 Kubernetes 将在每个探测之间等待的秒数。timeoutSeconds指定 Kubernetes 将在超时前等待 API 响应的秒数。超时被解释为失败。failureThreshold指定在Kubernetes 认为容器失活或尚未就绪之前的次数。
Dapr dashboard
Dapr 仪表板
Dapr offers a dashboard that presents status information on Dapr applications, components, and configurations. Use the Dapr CLI to start the dashboard as a web-application on the local machine on port 8080:
Dapr 提供了一个仪表板,用于显示Dapr 应用程序、组件和配置的状态信息。 使用 Dapr CLI 将仪表板作为本地计算机上的 web 应用程序在8080端口上启动:
dapr dashboard
For Dapr application running in Kubernetes, use the following command:
对于在 Kubernetes 中运行的 Dapr 应用程序,请使用以下命令:
dapr dashboard -k
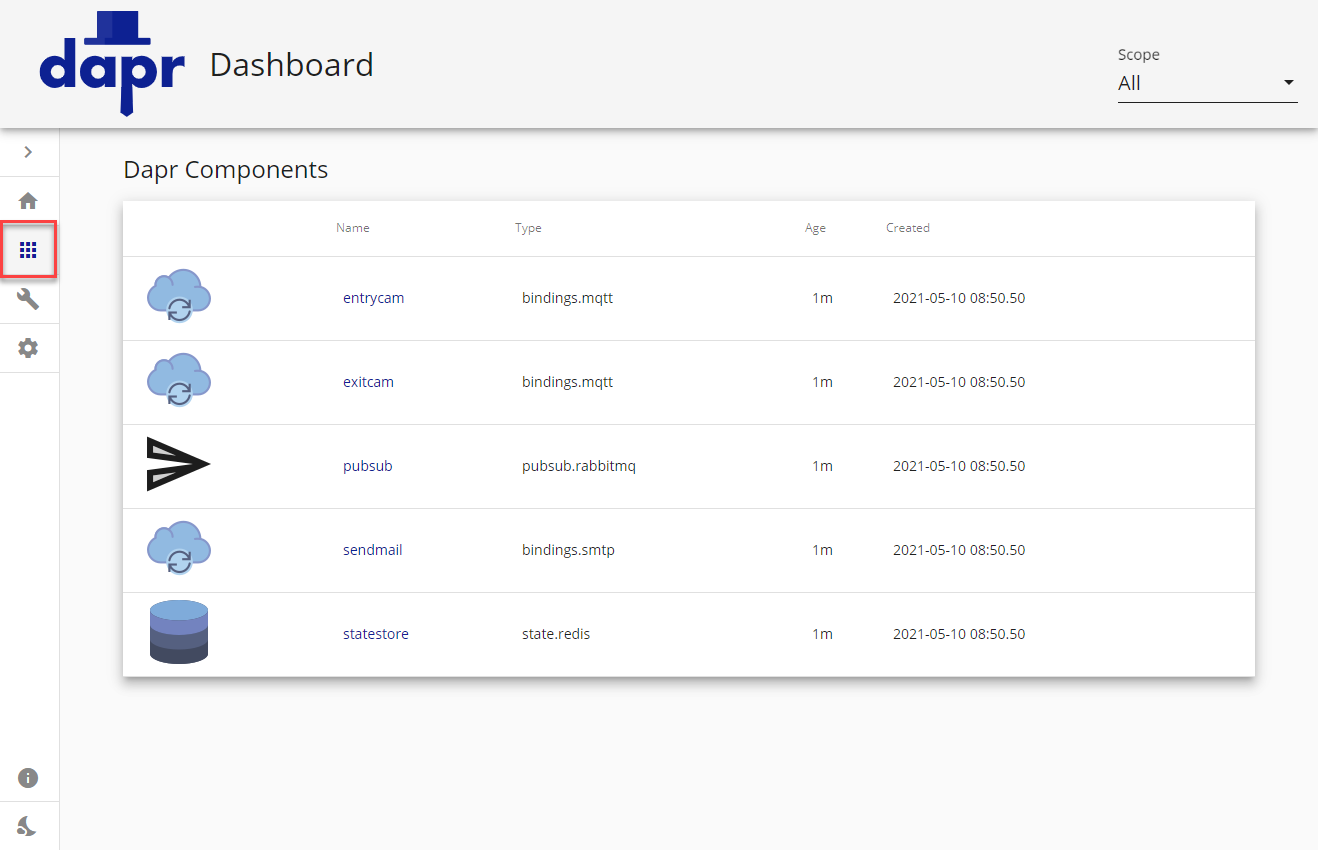
The dashboard opens with an overview of all services in your application that have a Dapr sidecar. The following screenshot shows the Dapr dashboard for the eShopOnDapr application running in Kubernetes:
打开仪表板,其中概述了应用程序中具有 Dapr 边车的所有服务。 以下屏幕截图显示了 Kubernetes 中运行的 eShopOnDapr 应用程序的 Dapr 仪表板:
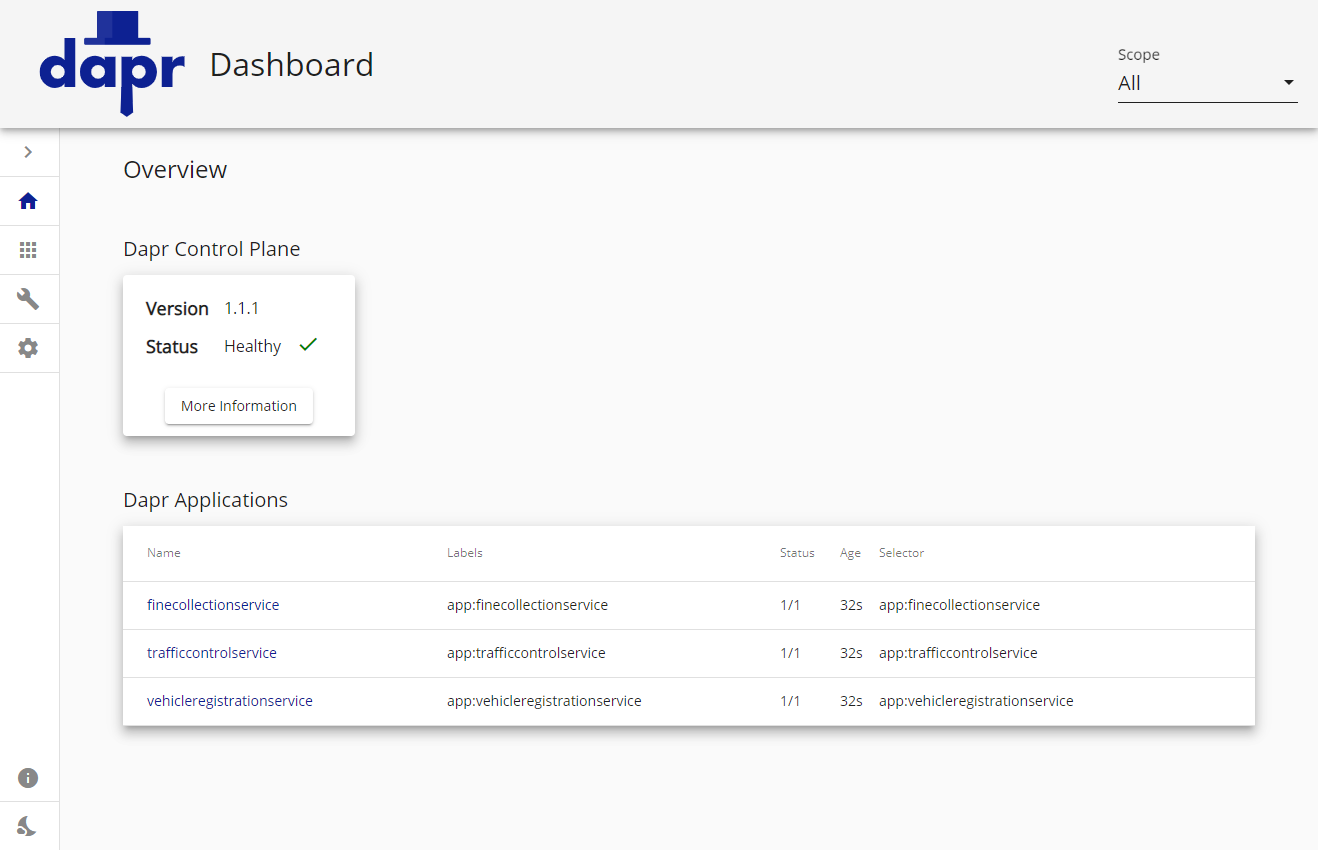
The Dapr dashboard is invaluable when troubleshooting a Dapr application. It provides information about Dapr sidecars and system services. You can drill down into the configuration of each service, including the logging entries.
在对 Dapr 应用程序进行故障排除时,Dapr 仪表板非常有用。 它提供 Dapr 边车和系统服务的有关信息。 可以向下钻取到每个服务的配置,包括日志记录条目。
The dashboard also shows the configured components (and their configuration) for your application:
仪表板还显示应用程序已配置的组件 (及其配置):
There's a large amount of information available through the dashboard. You can discover it by running a Dapr application and browsing the dashboard. You can use the accompanying eShopOnDapr application to start.
可以通过仪表板获取大量信息。 可以通过运行 Dapr 应用程序并浏览仪表板来发现它。 可以使用随附的 eShopOnDapr 应用程序来开启。
Check out the Dapr dashboard CLI command reference in the Dapr docs for more information on the Dapr dashboard commands.
有关 Dapr 仪表板命令 详细信息,请查看 Dapr 文档中的 Dapr 仪表板 CLI 命令参考。
Use the Dapr .NET SDK
使用 Dapr .NET SDK
The Dapr .NET SDK doesn't contain any specific observability features. All observability features are offered at the Dapr level.
Dapr .NET SDK 不包含任何特定的可观测性功能。 所有可观测性功能在 Dapr 级别提供。
If you want to emit telemetry from your .NET application code, you should consider the OpenTelemetry SDK for .NET. The Open Telemetry project is cross-platform, open source, and vendor agnostic. It provides an end-to-end implementation to generate, emit, collect, process, and export telemetry data. There's a single instrumentation library per language that supports automatic and manual instrumentation. Telemetry is published using the Open Telemetry standard. The project has broad industry support and adoption from cloud providers, vendors, and end users.
如果要从 .NET 应用程序代码发出遥测,应考虑 使用 OpenTelemetry SDK for .NET。 Open Telemetry 项目是跨平台、开源和供应商无关的。 它提供端到端实现,用于生成、发出、收集、处理和导出遥测数据。 每种语言有一个支持自动和手动检测的检测库。 遥测是使用开放遥测标准发布的。 该项目受广泛的行业(来自云提供商、供应商和最终用户)支持和采用。
Reference application: eShopOnDapr
参考应用程序:eShopOnDapr
Observability in accompanying eShopOnDapr reference application consists of several parts. Telemetry from all of the sidecars is captured. Additionally, there are other observability features inherited from the earlier eShopOnContainers sample.
随附的 eShopOnDapr 参考应用程序中的可观测性由多个部分组成。 捕获来自所有 边车的遥测数据。 此外,还有其他可观察性功能,这些功能继承自早期的 eShopOnContainers 示例。
Custom health dashboard
自定义运行状况仪表板
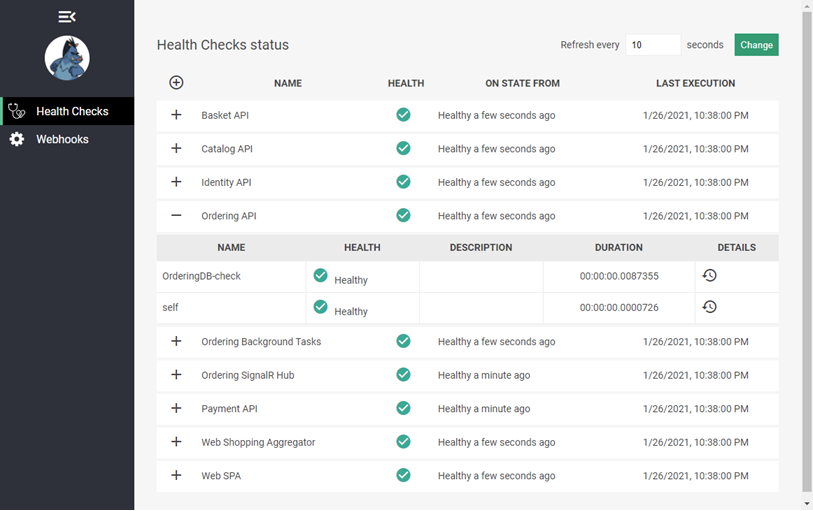
The WebStatus project in eShopOnDapr is a custom health dashboard that gives insight into the health of the eShop services. This dashboard doesn't use the Dapr health API but uses the built-in health checks mechanism of ASP.NET Core. The dashboard not only provides the health status of the services, but also the health of the dependencies of the services. For example, a service that uses a database also provides the health status of this database as shown in the following screenshot:
eShopOnDapr 中的 WebStatus 项目是一个自定义运行状况仪表板,可让你深入了解 eShop 服务的运行状况。 此仪表板不使用 Dapr health API,但使用 ASP.NET Core 的内置 运行状况检查机制 。 该仪表板不仅提供服务的运行状况状态,还提供服务依赖项的运行状况。 例如,使用数据库的服务还提供此数据库的运行状况状态,如以下屏幕截图所示:
Seq log aggregator
Seq 日志聚合器
Seq is a popular log aggregator server that is used in eShopOnDapr to aggregate logs. Seq ingests logging from application services, but not from Dapr system services or sidecars. Seq indexes application logging and offers a web front end for analyzing and querying the logs. It also offers functionality for building monitoring dashboards.
Seq 是在 eShopOnDapr 中用于聚合日志的常用日志聚合服务。 Seq 从应用程序服务中摄入日志记录,而不是从 Dapr 系统服务或边车。 Seq 检索应用程序日志记录,提供一个 web 前端用于分析和查询日志。 它还提供了用于构建监视仪表板的功能。
The eShopOnDapr application services emit structured logging using the SeriLog logging library. Serilog publishes log events to a construct called a sink. A sink is simply a target platform to which Serilog writes its logging events. Many Serilog sinks are available, including one for Seq. Seq is the Serilog sink used in eShopOnDapr.
eShopOnDapr 应用程序服务使用 SeriLog 日志记录库发出结构化日志记录。 Serilog 将日志事件发布到"接收器"。 接收器只是 Serilog 日志记录事件的目标写入平台。 有许多 Serilog 接收器都可供使用,包括 Seq 接收器。 Seq 是 eShopOnDapr 中使用的 Serilog 接收器。
Application Insights
eShopOnDapr services also send telemetry directly to Azure Application Insights using the Microsoft Application Insights SDK for .NET Core. For more information, see Azure Application Insights for ASP.NET Core applications in the Microsoft docs.
eShopOnDapr 服务还使用适用于 .NET Core 的 Microsoft Application Insights SDK 将遥测直接发送到 Azure Application Insights。 有关详细信息,请参阅 Microsoft 文档中的 Azure Application Insights for ASP.NET Core 应用程序 。
Summary
总结
Good observability is crucial when running a distributed system in production.
在生产环境中运行分布式系统时,良好的可观察性是至关重要的。
Dapr provides different types of telemetry, including distributed tracing, logging, metrics, and health status.
Dapr 提供不同类型的遥测,包括分布式跟踪、日志记录、指标和运行状况。
Dapr only produces telemetry for the Dapr system services and sidecars. Telemetry from your application code isn't automatically included. You can however use a specific SDK like the OpenTelemetry SDK for .NET to emit telemetry from your application code.
Dapr 仅为 Dapr 系统服务和边车生成遥测数据。 不会自动包含来自应用程序代码的遥测数据。 但是,可以使用 OpenTelemetry SDK for .NET 等特定 SDK 从应用程序代码发出遥测数据。
Dapr telemetry is produced in an open-standards based format so it can be ingested by a large set of available monitoring tools. Some examples are: Zipkin, Azure Application Insights, the ELK Stack, New Relic, and Grafana. See Monitor your application with Dapr in the Dapr documentation for tutorials on how to monitor your Dapr applications with specific monitoring back ends.
Dapr 遥测以基于开放标准的格式生成,因此可以被大量可用的监视工具摄入(接收)。 一些示例包括:Zipkin、Azure Application Insights、ELK Stack、New Relic和 Grafana。 请参阅 Dapr 文档中的使用 Dapr 监视应用程序来了解演练如何使用特定监控后端监视Dapr应用。
You'll need a telemetry scraper that ingests telemetry and publishes it to the monitoring back end.
你需要一个遥测抓取器,摄入遥测数据并将遥测数据发布到监视后端。
Dapr can be configured to emit structured logging. Structured logging is favored as it can be indexed by back-end monitoring tools. Indexed logging enables users to execute rich queries when searching through the logging.
Dapr 可以配置为发出结构化日志记录。 结构化日志记录更受欢迎,因为它可以被后端监视工具检索。 索引化日志记录使用户能够在搜索日志记录时执行富查询。
Dapr offers a dashboard that presents information about the Dapr services and configuration.
Dapr 提供一个仪表板,用于显示有关 Dapr 服务和配置的信息。
