1、示例代码
import numpy as np
import matplotlib.pyplot as plt
# 生成数据
x = np.arange(10) + 1
y1 = np.random.randint(1, 3, 10)
y2 = np.full(x.shape, 2)
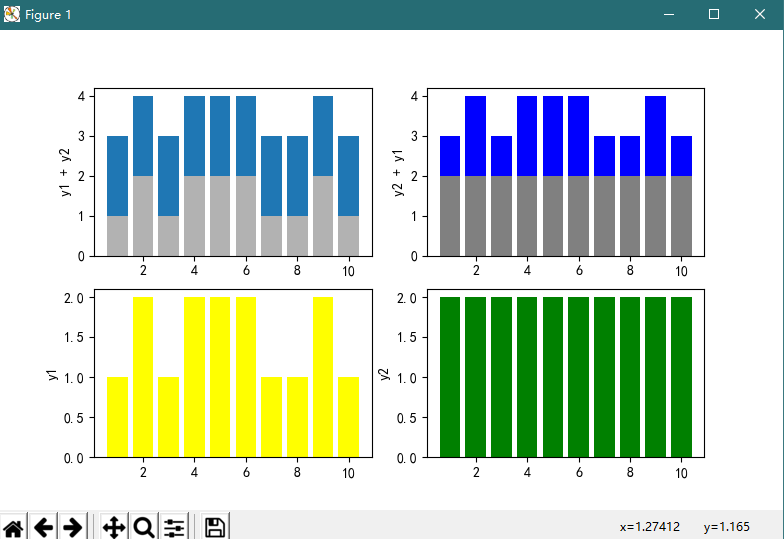
# 在左下的子图绘制 y1 的条形图
plt.subplot(223)
plt.bar(x, y1, color='yellow' )
plt.ylabel('y1')
# 在右下的子图中绘制 y2 的条形图
plt.subplot(224)
plt.bar(x, y2, color='green')
plt.ylabel('y2')
# 在左上的子图中绘制堆积柱形图
plt.subplot(221)
plt.bar(x, y1, color='k', alpha=0.3)
plt.bar(x, y2, bottom=y1)
plt.ylabel('y1 + y2')‘
# 在右上的子图中绘制堆积柱形图
plt.subplot(222)
plt.bar(x, y2, color='gray')
plt.bar(x, y1, bottom=y2, color='b')
plt.ylabel('y2 + y1')
plt.show()
2、图形
。。。