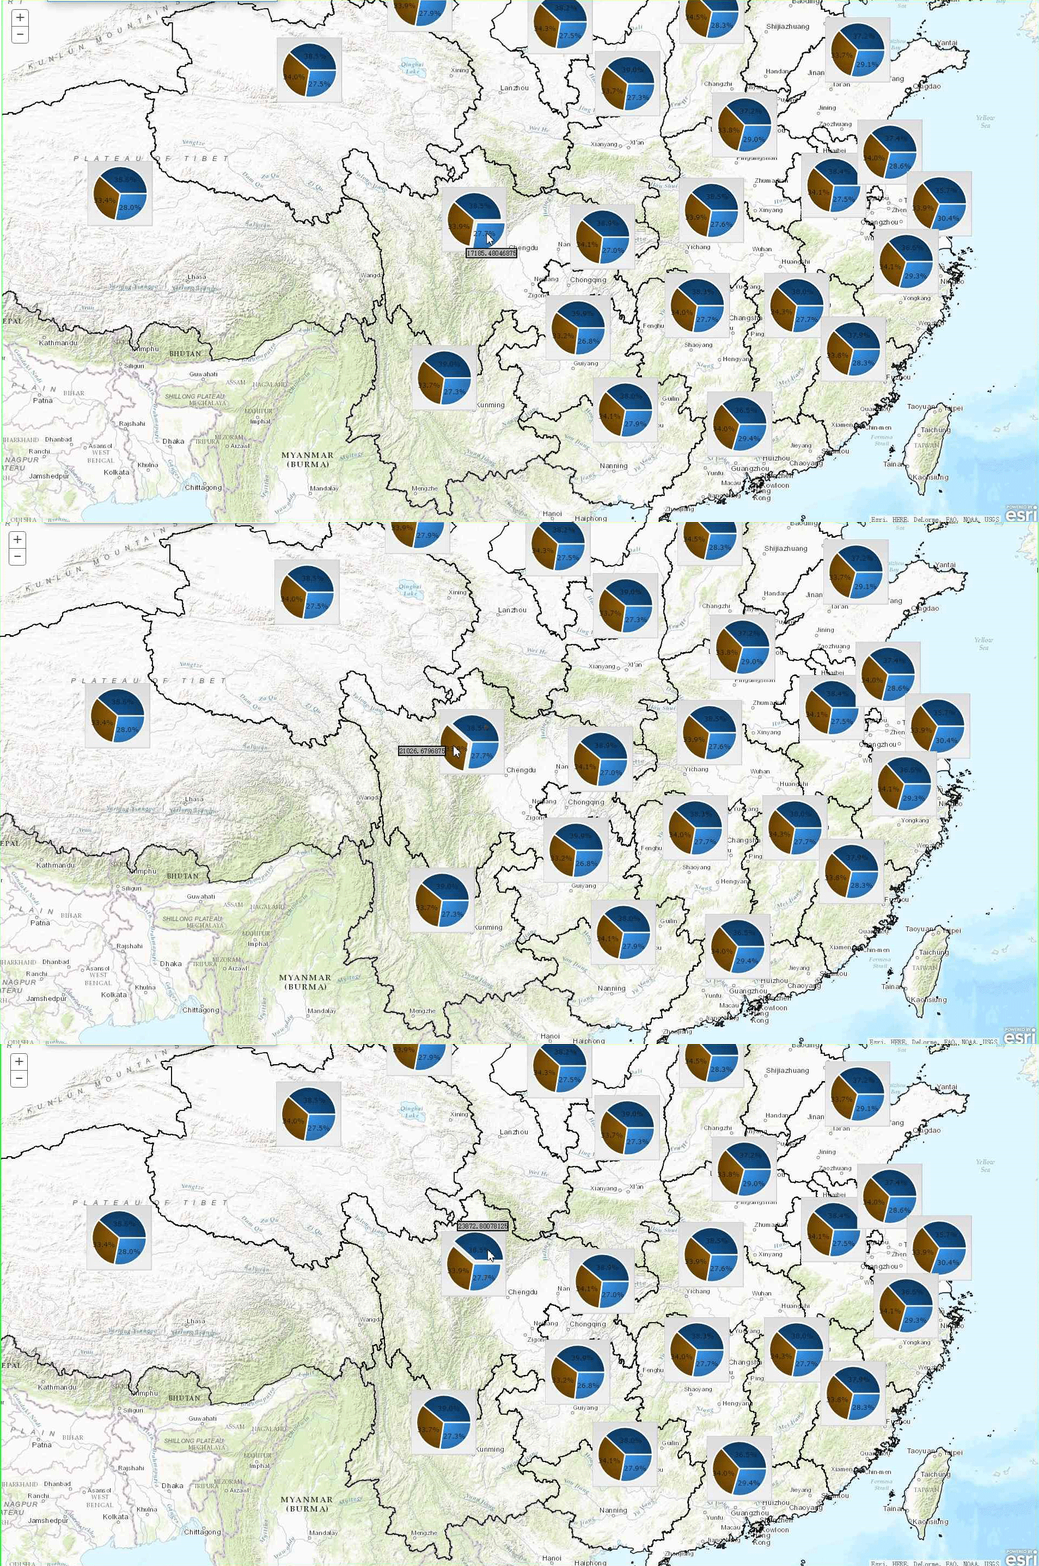
图1
图2
图3
-------------------------------------华丽丽的分割线-----------------------------------
图4
图5
……图片欣赏到这吧,我想各位已经知道要表达什么了。先来解释一下图片,图1、2和3是12、13和14三年的生产总值在ArcMap的不同表达,是不是觉得表达很简单、很直观也很粗暴!图4和图5展示的是全国农林牧渔业发生洪涝灾害后的统计情况,这个可是在浏览器上展示的噢,只是展示的,然而。。。。。。然而在这个网络流行的社会,我们不会为了看到这样一副美丽直观的地图来携带这个ArcMap或者对每一种表达都发一个如图4和图5这样效果的服务。而且,还不能和地图交互,同时,伟大的ArcGIS API for JavaScript也没有提供相关接口,是不是感觉到天已经黑了。
他们的内心是崩溃的……
伟大的GISer来了———想要和地图交互效果的众生们,你们的黎明就要来了!
话说回来,实现图表上图,个人理解有两种方式。
某天在AGS群里突然发现有个大神(望留名)已经实现的在地图上面展示图表的,而且自己写了图标的样式。部分代码如下:
constructor: function (parameters) {
		        lang.mixin(this, parameters);
		        isContentShowing = false;

		        domClass.add(this.domNode, "myInfoWindow");
		        this._content = domConstruct.create("div", { "class": "content" }, this.domNode);
		        this._eventConnections = [];
		        domUtils.hide(this.domNode);
		        this.isShowing = false;
		    },

		    setMap: function (map) {
		        this.inherited(arguments);
		        this._eventConnections.push(map.on("pan", lang.hitch(this, this.__onMapPan)));
		        this._eventConnections.push(map.on("extent-change", lang.hitch(this, this.__onMapExtChg)));
		        this._eventConnections.push(map.on("zoom-start", lang.hitch(this, this.__onMapZmStart)));
		        this._eventConnections.push(map.on("zoom", lang.hitch(this, this.onMapZm)));
		    },
其代码调用部分:
var infoWindow = new ChartInfoWindow({
                         domNode: domConstruct.create('div', null, document.getElementById('map'))
                    });
                    infoWindow.setMap(map);

                    var nodeChart = null;
                    nodeChart = domConstruct.create("div", { id: 'nodeTest' + i, style: "120px;height:50px" }, win.body());
                    var chart = makeChart(nodeChart,showFields,max,i);
                    //optinalChart = chart;
                    infoWindow.resize(122, 52);

					//计算几何的中心位置,将图表信息框放置于此
					var labelPt = new Point(Data[i][1],Data[i][2],map.SpatialReference);
                    infoWindow.setContent(nodeChart);
                    infoWindow.__mcoords = labelPt;
                    infoWindow.show(map.toScreen(labelPt));
按照程序员的做法,肯定是啃源码!一看,其大致思路是infowindowbase,一看调用,确实有点费劲,心里痒痒、所以走起了我的代码优化之路,经过混天地暗的奋斗,终于搞定。
constructor: function (parameters) {//map, chartPoint, chart, width, height
		        lang.mixin(this, parameters);
		        isContentShowing = false;
                this.domNode= domConstruct.create('div',null, document.getElementById('map_root').parentNode);
                domClass.add(this.domNode, "myInfoWindow");
				domUtils.hide(this.domNode);
                this._content = domConstruct.create("div", { "class": "content"}, this.domNode);
                this.setContent(this.chart);
				this.__mcoords= this.chartPoint;
		        this._eventConnections = [];
		        this.isShowing = false;
				this.setMap(this.map);
				this.show(this.map.toScreen(this.chartPoint));
				this.resize(this.width, this.height);
		    },
调用部分:
var chartInfo= new ChartInfoWindow({
                                    map: map,
                                    chart:nodeChart,
                                    chartPoint: chartPoint,
                                     123,
                                    height: 123
                                });
一点运行心情如同下面这图画。
哈哈,不说废话了,直接看结果。

写在最后:
代码实现了从地图要素中读取属性数据,然后用dojo的图表展示出来。当然也可以使用Echarts、amCharts、D3或者highCharts等等的。祝好运。
测试示例依然存在一些Bug和美观问题,如背景非透明(这是图表框架限制的……)、图表压盖等。还请期待。


