环境配置
| 节点 | 配置 | 类型 | 操作系统 |
|---|---|---|---|
| Sched | 2G 2CPU 50GB ens3=>192.168.200.11 | KVM虚拟机 | CentOS 7 |
| Nova | 4G 2CPU 50GB ens3=>192.168.2000.12 | KVM虚拟机 | CentOS 7 |
Nova节点配置
安装Collectd
# yum install epel-release
# yum makecache
# yum install collectd -y
# systemctl start collectd
# systemctl enable collectd
配置Collectd
# vim /etc/collectd.conf
LoadPlugin network
<Plugin network>
        <Server "192.168.200.11" "25826">
        </Server>
</Plugin>
# systemctl restart collectd
# scp /usr/share/collectd/types.db root@192.168.200.11:~/
Sched节点配置
配置软件源
# cat <<EOF | sudo tee /etc/yum.repos.d/influxdb.repo
[influxdb]
name = InfluxDB Repository - RHEL $releasever
baseurl = https://repos.influxdata.com/rhel/$releasever/$basearch/stable
enabled = 1
gpgcheck = 1
gpgkey = https://repos.influxdata.com/influxdb.key
EOF

# yum makecache
安装InfluxDB
# yum install influxdb -y

### 设置开机启动
# systemctl start influxdb
# systemctl enable influxdb

### 查询InfluxDB默认配置
# influxd config

### 如果不是使用标准的默认目录,需要手动修改目录权限
# chown -R influxdb:influxdb /mnt/influx
# chown -R influxdb:influxdb /mnt/db
配置InfluxDB
# mkdir -p /usr/share/collectd/
# mv types.db /usr/share/collectd/
# vim /etc/influxdb/influxdb.conf
[[collectd]]
  enabled = true
  bind-address = "0.0.0.0:25826"

### 查询配置是否生效
# influxd config
# systemctl restart influxdb
# systemctl stop firewalld
# systemctl disable firewalld

### 查询数据插入是否正常
> SHOW DATABASES
name: databases
name
----
_internal
collectd

> use collectd
Using database collectd
>
安装Grafana
# yum install https://s3-us-west-2.amazonaws.com/grafana-releases/release/grafana-4.2.0-1.x86_64.rpm

### 设置开机启动
# systemctl daemon-reload
# systemctl start grafana-server
# systemctl status grafana-server
# systemctl enable grafana-server

### 访问http://192.168.200.11:3000/login,默认用户名密码admin:admin,默认配置信息可查询/etc/grafana/grafana.ini文件
配置Grafana
### 数据库默认用户名密码root:root
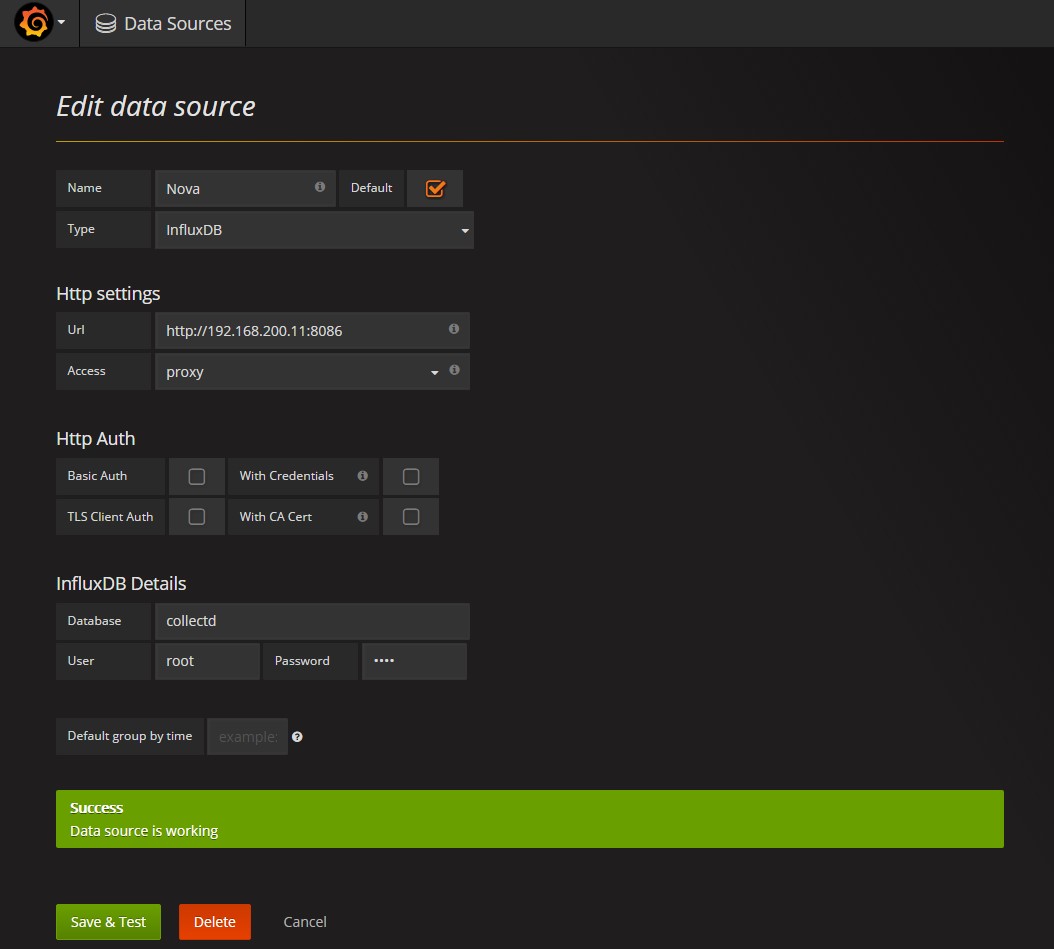
配置数据源
配置控制面板

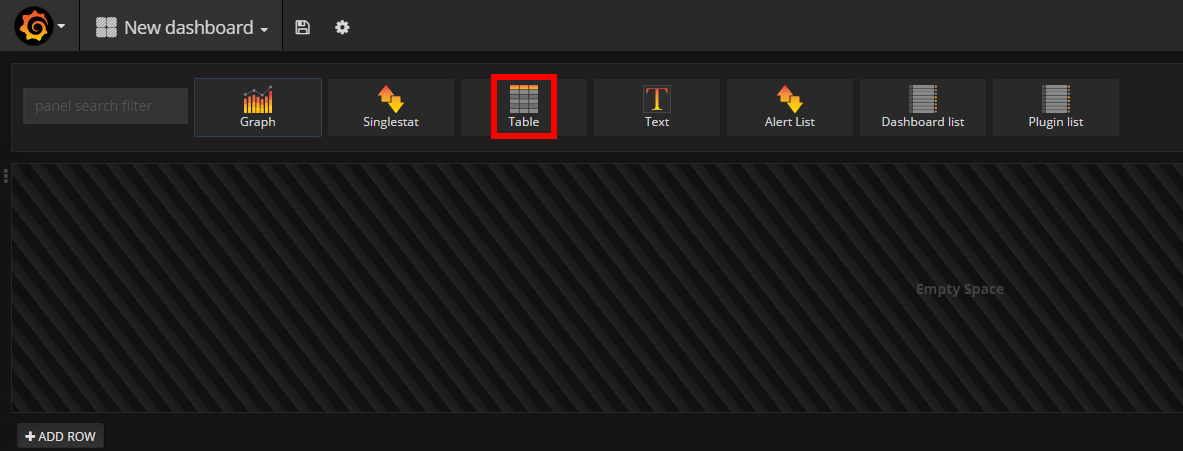
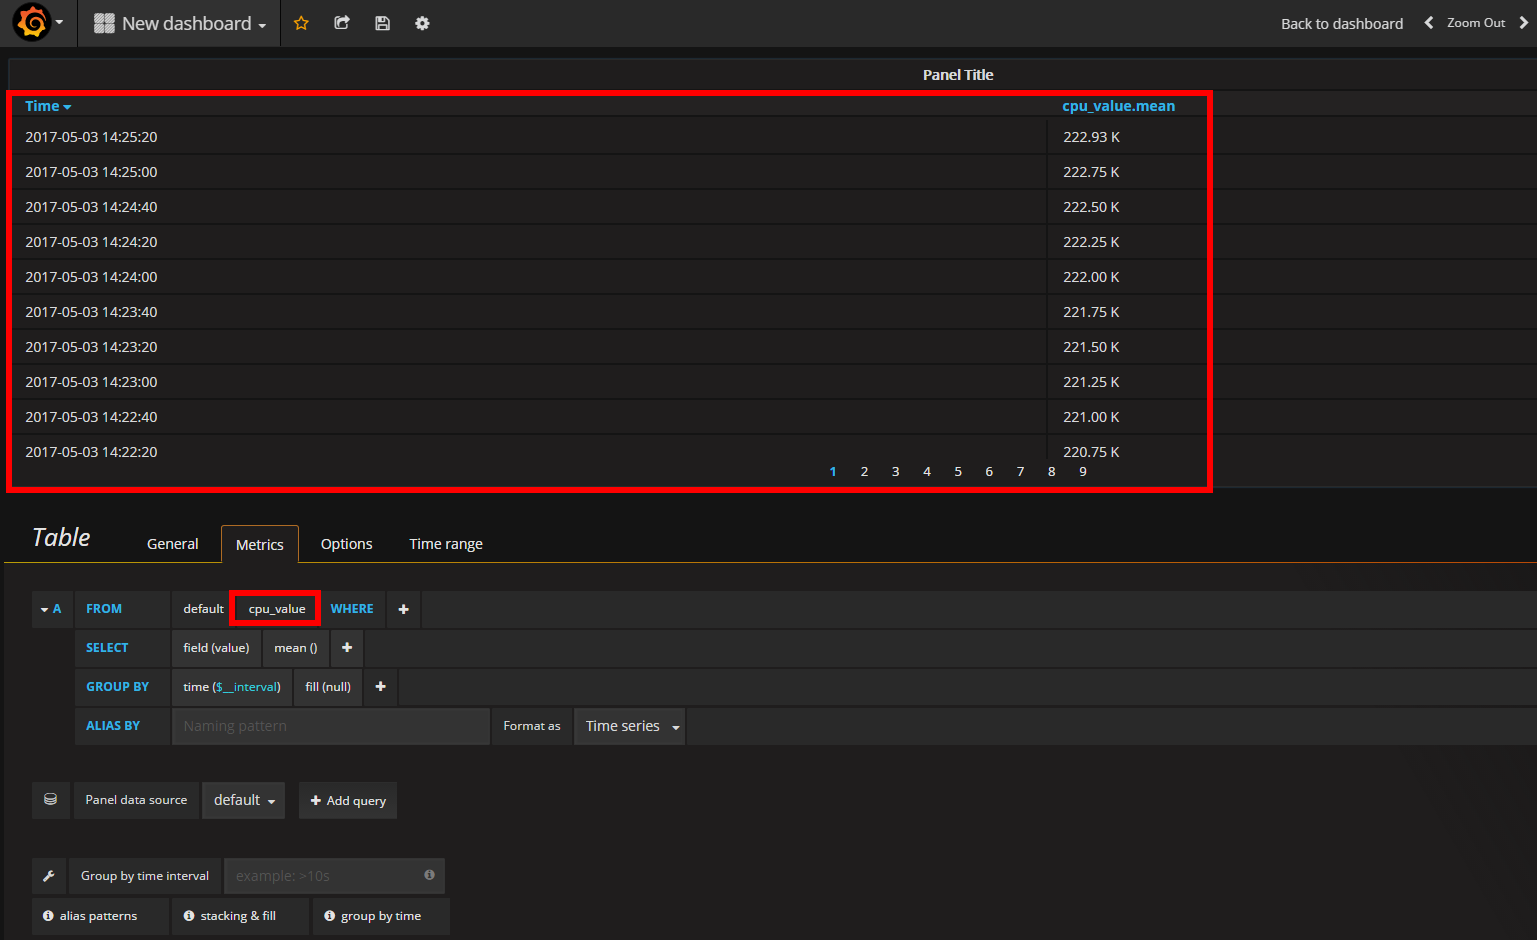
添加表格到控制面板
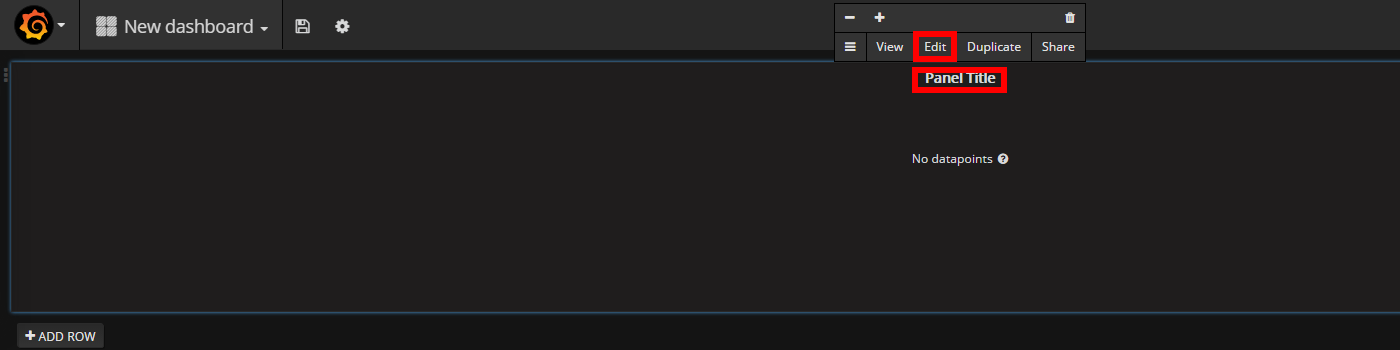
配置表格显示规则
设置查询规则
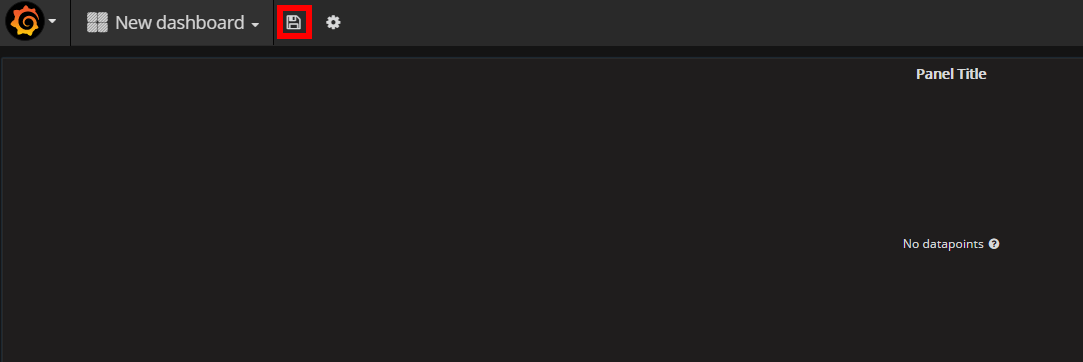
保存控制面板