zoukankan      html  css  js  c++  java
  • vue中使用echarts遇到的Error in v-on handler: "TypeError: Cannot read property 'getAttribute' of null"

    今天在项目中使用echarts ,项目中,需要点击对应的图片,来对折线图和柱状图的切换

     首先,HTML代码是这样子的:

    <div v-if="showType==1" id="lineChart" style=" 100%;height:100%;"></div>
    
    <div v-if="showType==2" id="columnChart" style=" 600px;height:400px;"></div>

    其次,js代码:

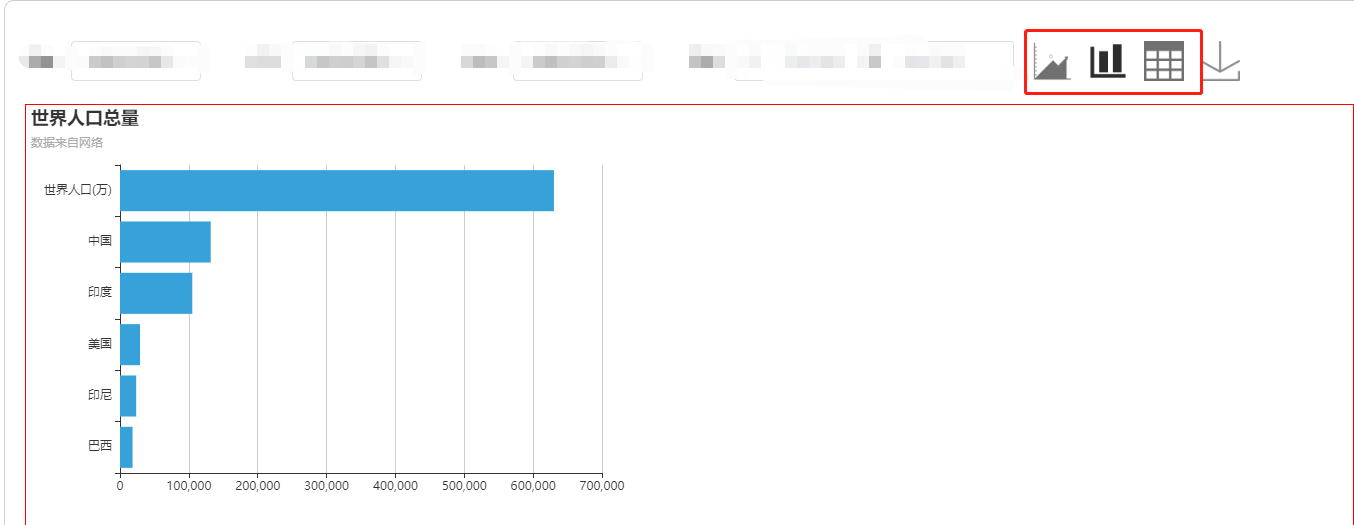
    loadEcharts(type) {
        var that = this;
        if (type == 1) {
            that.showType = 1;
            // 基于准备好的dom,初始化echarts实例
            var myChart = echarts.init(document.getElementById('lineChart'), 'light');
            var option = {
                title: {
                    text: '未来一周气温变化',
                    subtext: '纯属虚构'
                },
                tooltip: {
                    trigger: 'axis'
                },
                legend: {
                    data: ['最高气温', '最低气温']
                },
                toolbox: {
                    show: true,
                    feature: {
                        dataZoom: {
                            yAxisIndex: 'none'
                        },
                        dataView: { readOnly: false },
                        magicType: { type: ['line', 'bar'] },
                        restore: {},
                        saveAsImage: {}
                    }
                },
                xAxis: {
                    type: 'category',
                    boundaryGap: false,
                    data: ['周一', '周二', '周三', '周四', '周五', '周六', '周日']
                },
                yAxis: {
                    type: 'value',
                    axisLabel: {
                        formatter: '{value} °C'
                    }
                },
                series: [
                    {
                        name: '最高气温',
                        type: 'line',
                        data: [11, 11, 15, 13, 12, 13, 10],
                        markPoint: {
                            data: [
                                { type: 'max', name: '最大值' },
                                { type: 'min', name: '最小值' }
                            ]
                        },
                        markLine: {
                            data: [
                                { type: 'average', name: '平均值' }
                            ]
                        }
                    },
                    {
                        name: '最低气温',
                        type: 'line',
                        data: [1, -2, 2, 5, 3, 2, 0],
                        markPoint: {
                            data: [
                                { name: '周最低', value: -2, xAxis: 1, yAxis: -1.5 }
                            ]
                        },
                        markLine: {
                            data: [
                                { type: 'average', name: '平均值' },
                                [{
                                    symbol: 'none',
                                    x: '90%',
                                    yAxis: 'max'
                                }, {
                                    symbol: 'circle',
                                    label: {
                                        position: 'start',
                                        formatter: '最大值'
                                    },
                                    type: 'max',
                                    name: '最高点'
                                }]
                            ]
                        }
                    }
                ]
            };
            // 使用刚指定的配置项和数据显示图表。
            myChart.setOption(option);
        } else {
            that.showType = 2;
            // 基于准备好的dom,初始化echarts实例
            var myChart = echarts.init(document.getElementById('columnChart'), 'light');
            // 指定图表的配置项和数据
            var option = {
                title: {
                    text: '世界人口总量',
                    subtext: '数据来自网络'
                },
                tooltip: {
                    trigger: 'axis',
                    axisPointer: {
                        type: 'shadow'
                    }
                },
                grid: {
                    left: '3%',
                    right: '4%',
                    bottom: '3%',
                    containLabel: true
                },
                xAxis: {
                    type: 'value',
                    boundaryGap: [0, 0.01]
                },
                yAxis: {
                    type: 'category',
                    data: ['巴西', '印尼', '美国', '印度', '中国', '世界人口(万)']
                },
                series: [
                    {
                        type: 'bar',
                        data: [18203, 23489, 29034, 104970, 131744, 630230]
                    }
                ]
            };
    
    
            // 使用刚指定的配置项和数据显示图表。
            myChart.setOption(option);
        }
    
    
    },

    来回切换的时候,总是报错:"TypeError: Cannot read property 'getAttribute' of undefined"的错。。

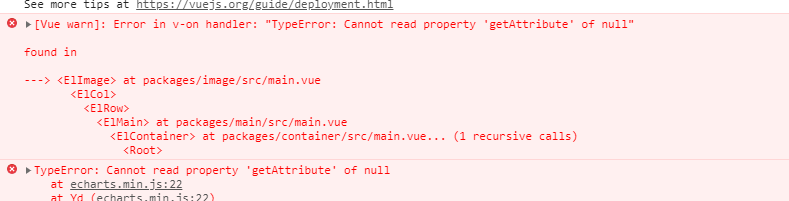
     后来百度了一下,说是dom没有加载完的问题,要放在this.$nextTick改成

    mounted() {
        this.$nextTick(() => {
          this.drawLine();
        });
      }

    这样可以了。

    后来测试 了下,用vif控制 隐藏与显示也是报这样的错。。vshow不会。

    原理还是一样吧,vif是dom不加载 的。vshow只是把dom display:none,还是加载了

  • 相关阅读:
    表单数据源控制器笔记
    方法汇总1
    Persistence.beans
    数据库外键理解
    SQL语句缺少
    树型结构需要绑定的字段
    模型绑定替换
    乱码
    表单的验证:客户端验证和服务器端验证
    表单
  • 原文地址:https://www.cnblogs.com/taotaozhuanyong/p/12625911.html
Copyright © 2011-2022 走看看