原文链接:http://tecdat.cn/?p=12111
在本文中,我将向您展示如何模拟股票价格的Heston随机波动率模型。
Heston模型是针对具有随机波动性的期权,并于1993年申请了债券的货币期权。对于固定的无风险利率![]() ,其描述为:
,其描述为:
![]()
通过使用这种模型,可以得出欧洲看涨期权的价格 。
这是函数的描述。
callHestoncf(S, X, tau, r, v0, vT, rho, k, sigma){
# S = Spot, X = Strike, tau = time to maturity
# r = risk-free rate, q = dividend yield
# v0 = initial variance, vT = long run variance (theta)
# rho = correlation, k = speed of mean reversion (kappa)
# sigma = volatility of volatility
}现在,进行蒙特卡洛定价。我们将为3个欧洲看涨期权定价![]() ,具有3种不同的执行价格。我们在15年中使用100000个模拟,每个月进行一次。以下是对仿真有用的参数:
,具有3种不同的执行价格。我们在15年中使用100000个模拟,每个月进行一次。以下是对仿真有用的参数:
#Initial stock price
S0 <- 100
# Number of simulations (feel free to reduce this)
n <- 100000
# Sampling frequency
freq <- "monthly"
# volatility mean-reversion speed
kappa <- 0.003
# volatility of volatility
volvol <- 0.009
# Correlation between stoch. vol and spot prices
rho <- -0.5
# Initial variance
V0 <- 0.04
# long-term variance
theta <- 0.04
#Initial short rate
r0 <- 0.015

# Options maturities
horizon <- 15
# Options' exercise prices
strikes <- c(140, 100, 60)
为了使用模拟Heston模型,我们首先需要定义如何进行模拟。
此函数提供一个包含2个成分的列表,每个成分包含模拟的随机高斯增量。
#  Stochastic volatility  simulation
sim.vol <- simdiff(n =  n, horizon =  horizon,
frequency =  freq, model = "CIR", x0 =  V0,
theta1 =  kappa*theta, theta2 =  kappa,
theta3 =  volvol, eps =  shocks[[1]])

# Stock prices simulation
sim.price <- simdiff(n = n, horizon = horizon,
frequency = freq, model = "GBM", x0 = S0,
theta1 = r0, theta2 = sqrt(sim.vol),
eps = shocks[[2]])
现在,我们可以使用3种不同的
计算期权价格。
# Stock price at maturity (15 years)
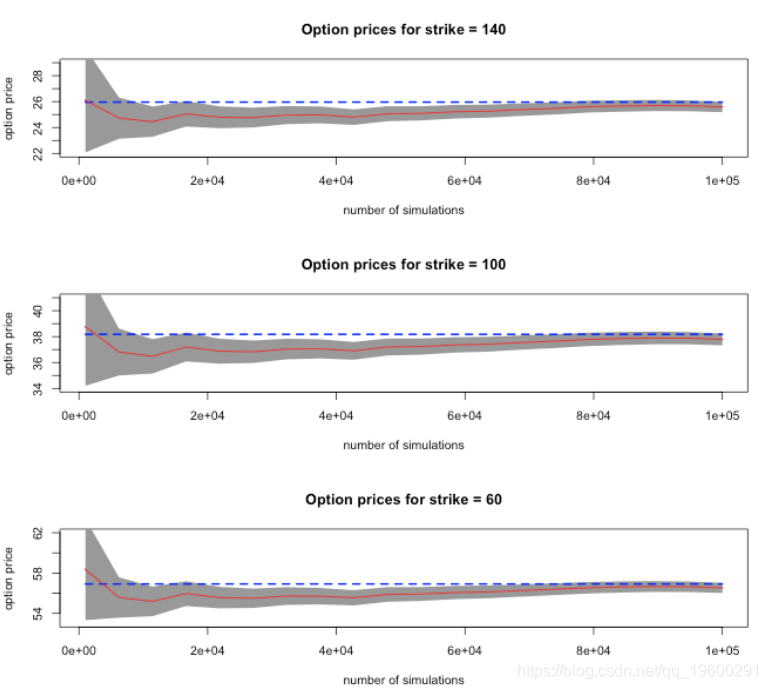
print(results)
strikes mcprices lower95 upper95 pricesAnalytic
1 140 25.59181 25.18569 25.99793 25.96174
2 100 37.78455 37.32418 38.24493 38.17851
3 60 56.53187 56.02380 57.03995 56.91809从这些结果中,我们看到这三个选项的蒙特卡洛价格与使用函数(直接使用公式来计算价格)计算出的价格相当接近。95%的置信区间包含理论价格。
下面是期权价格,作为模拟次数的函数。计算出的理论价格用蓝色绘制,蒙特卡洛平均价格用红色绘制,阴影区域表示均值(蒙特卡洛价格)周围的95%置信区间。
![]()