http://blog.csdn.net/gisshixisheng/article/details/46137015
概述:
在前面的博文中讲述过基于Arcgis for js如何实现聚类统计展示,在本文中讲述如何基于openlayers实现聚类统计的效果,Arcgis for js聚类统计的博文地址为:
http://blog.csdn.net/gisshixisheng/article/details/40867989
效果:
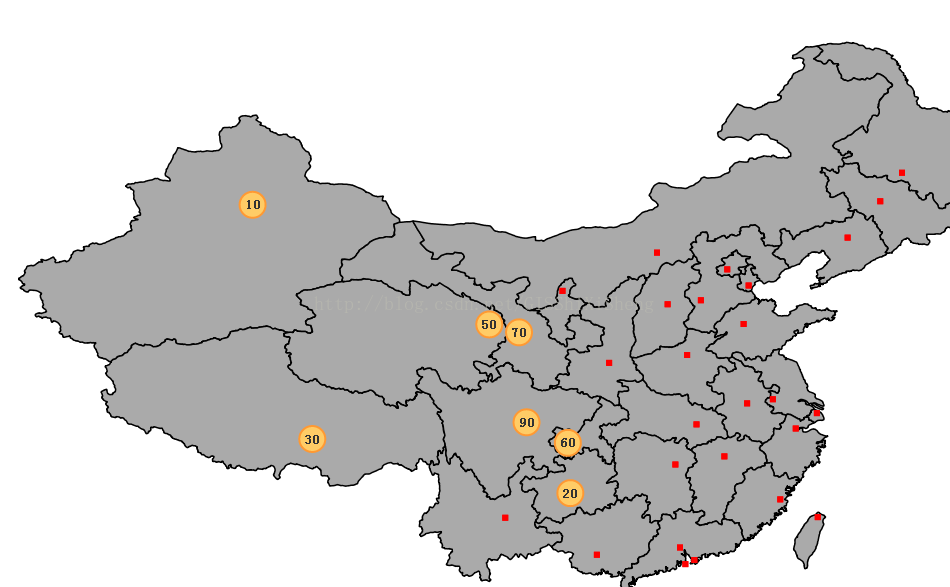
实现关键点:

实现代码:
1、数据格式

2、设置显示样式
- var style = new OpenLayers.Style({
- fillColor: "#ffcc66",
- strokeColor: "#ff9933",
- strokeWidth: 2,
- label: "${count}",
- fontColor: "#333333",
- fontFamily: "sans-serif",
- fontWeight: "bold"
- }, {
- rules: [
- new OpenLayers.Rule({
- minScaleDenominator: 100000000,
- symbolizer: {
- pointRadius: 7,
- fontSize: "9px"
- }
- }),
- new OpenLayers.Rule({
- maxScaleDenominator: 100000000,
- minScaleDenominator: 50000000,
- symbolizer: {
- pointRadius: 10,
- fontSize: "11px"
- }
- }),
- new OpenLayers.Rule({
- maxScaleDenominator: 50000000,
- symbolizer: {
- pointRadius: 13,
- fontSize: "13px"
- }
- })
- ]
- });
3、添加矢量图层
- var features = new Array();
- for (var i=0; i<data.length; i++) {
- features[i] = new OpenLayers.Feature.Vector(
- new OpenLayers.Geometry.Point(data[i].x, data[i].y),
- {
- count:data[i].count,
- name:data[i].name
- }
- );
- }
- var clusterLayer = new OpenLayers.Layer.Vector("Points", {
- styleMap: new OpenLayers.StyleMap(style)
- });
- clusterLayer.addFeatures(features);
- map1.addLayer(clusterLayer);
程序完整代码为;
- <!DOCTYPE html>
- <html>
- <head lang="en">
- <meta charset="UTF-8">
- <title>openlayers map</title>
- <link rel="stylesheet" href="http://localhost/olapi/theme/default/style.css" type="text/css">
- <style>
- html, body{
- padding:0;
- margin:0;
- height:100%;
- 100%;
- overflow: hidden;
- font-size: 12px;
- }
- #map1{
- 100%;
- height: 100%;
- float: left;
- border-right: 1px solid #000000;
- }
- </style>
- <script src="http://localhost/olapi/OpenLayers.js"></script>
- <script src="http://localhost/olapi/lib/OpenLayers/Lang/zh-CN.js"></script>
- <script src="http://localhost/jquery/jquery-1.8.3.js"></script>
- <script>
- var map1, vectors;
- OpenLayers.Feature.Vector.style['default']['strokeWidth'] = '2';
- $(function(){
- var bounds = new OpenLayers.Bounds(
- 73.45100463562233, 18.16324718764174,
- 134.97679764650596, 53.531943152223576
- );
- var options = {
- controls: [],
- maxExtent: bounds,
- maxResolution: 0.2403351289487642,
- projection: "EPSG:4326",
- units: 'degrees'
- };
- map1 = new OpenLayers.Map('map1', options);
- map1.addLayer(getWms("china"));
- map1.addControl(new OpenLayers.Control.Zoom());
- map1.addControl(new OpenLayers.Control.Navigation());
- map1.zoomToExtent(bounds);
- addCluster();
- });
- function getWms(layer){
- return new OpenLayers.Layer.WMS(
- "Geoserver layers - Tiled",
- "http://localhost:8081/geoserver/lzugis/wms",
- {
- "LAYERS": layer,
- "STYLES": '',
- format: 'image/png'
- },
- {
- buffer: 0,
- displayOutsideMaxExtent: true,
- isBaseLayer: true,
- yx : {'EPSG:4326' : true}
- }
- );
- }
- function addCluster(){
- var style = new OpenLayers.Style({
- fillColor: "#ffcc66",
- strokeColor: "#ff9933",
- strokeWidth: 2,
- label: "${count}",
- fontColor: "#333333",
- fontFamily: "sans-serif",
- fontWeight: "bold"
- }, {
- rules: [
- new OpenLayers.Rule({
- minScaleDenominator: 100000000,
- symbolizer: {
- pointRadius: 7,
- fontSize: "9px"
- }
- }),
- new OpenLayers.Rule({
- maxScaleDenominator: 100000000,
- minScaleDenominator: 50000000,
- symbolizer: {
- pointRadius: 10,
- fontSize: "11px"
- }
- }),
- new OpenLayers.Rule({
- maxScaleDenominator: 50000000,
- symbolizer: {
- pointRadius: 13,
- fontSize: "13px"
- }
- })
- ]
- });
- var data = [{name:"乌鲁木齐",x:87.5758285931,y:43.7822116460,count:10},
- {name:"拉萨",x:91.1629975040,y:29.7104204643,count:30},
- {name:"西宁",x:101.797302689,y:36.5936423859,count:50},
- {name:"兰州",x:103.584297498,y:36.1190864503,count:70},
- {name:"成都",x:104.035508297,y:30.7141790950,count:90},
- {name:"重庆",x:106.519115206,y:29.4789248520,count:60},
- {name:"贵阳",x:106.668071385,y:26.4573115457,count:20}];
- var features = new Array();
- for (var i=0; i<data.length; i++) {
- features[i] = new OpenLayers.Feature.Vector(
- new OpenLayers.Geometry.Point(data[i].x, data[i].y),
- {
- count:data[i].count,
- name:data[i].name
- }
- );
- }
- var clusterLayer = new OpenLayers.Layer.Vector("Points", {
- styleMap: new OpenLayers.StyleMap(style)
- });
- clusterLayer.addFeatures(features);
- map1.addLayer(clusterLayer);
- }
- </script>
- </head>
- <body>
- <div id="map1"></div>
- </body>
- </html>