http://blog.csdn.net/gisshixisheng/article/details/42025435
首先,看看具体的效果:

初始化状态
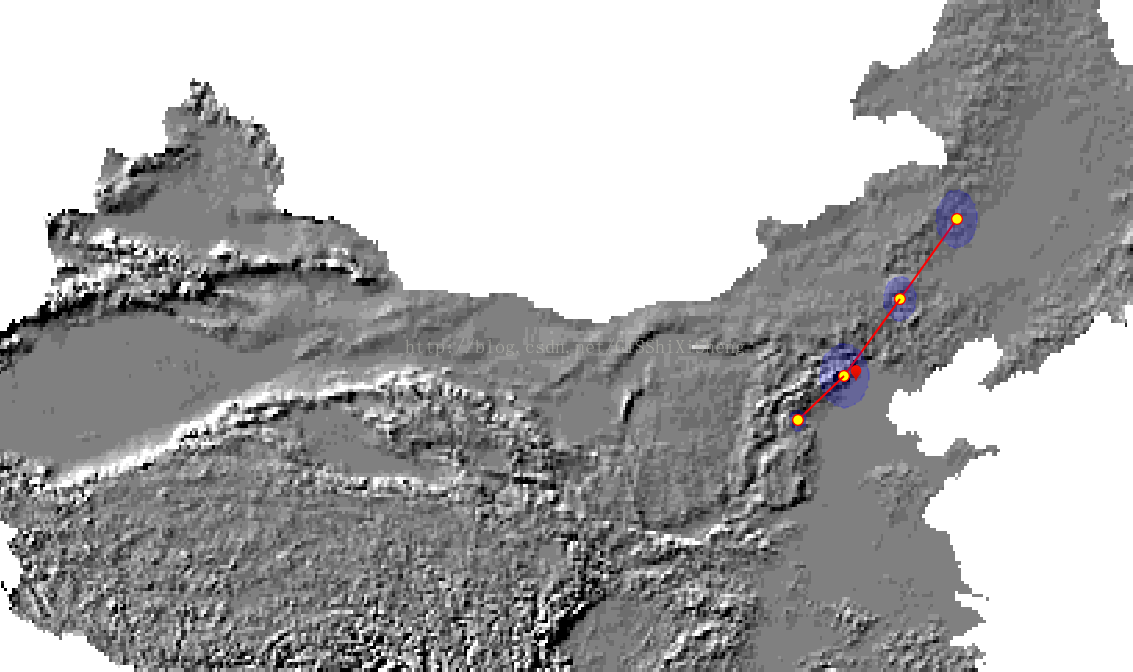
绘制中
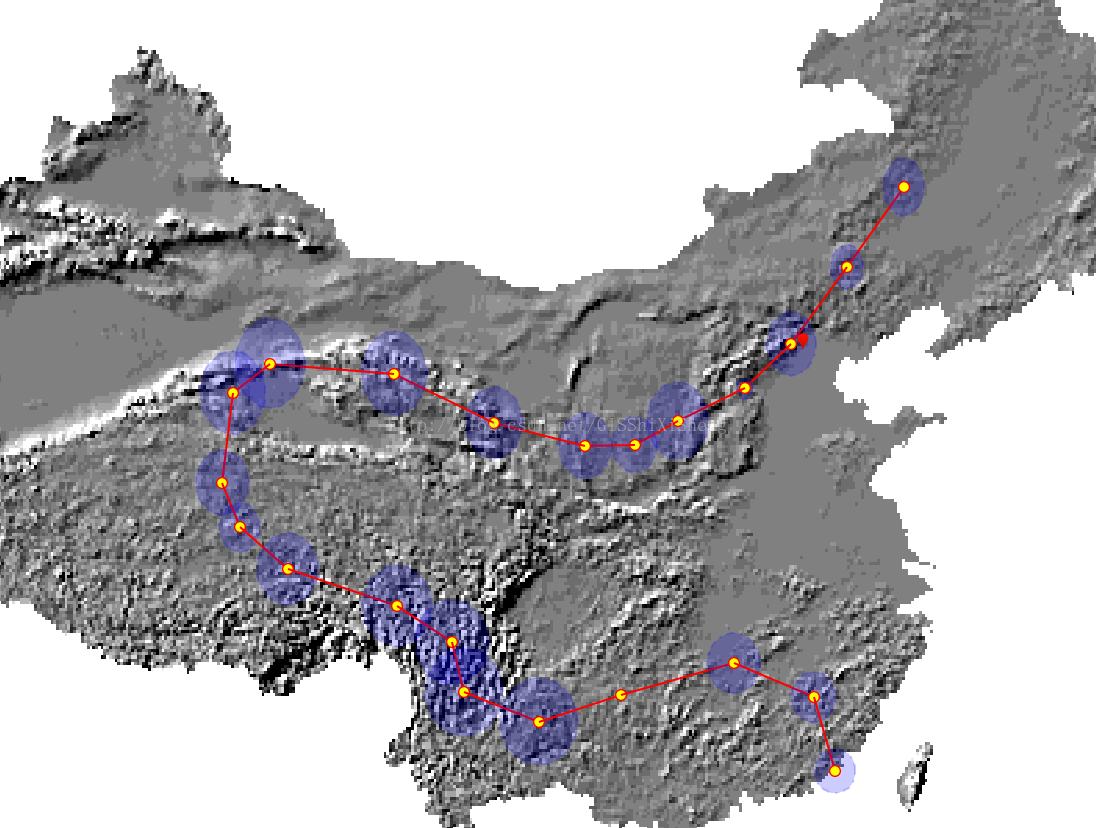
绘制完成
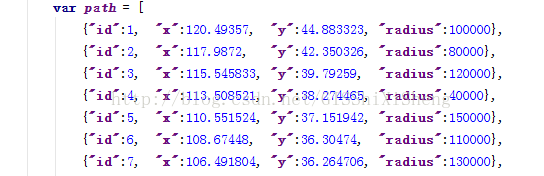
首先,组织数据。我组织的数据是JSON的,数据的具体形式如下:
其次,实现思路。
1、添加显示路径。
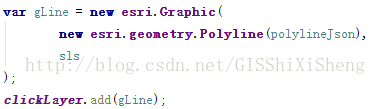
根据起始点,生成polyline的JSON格式。如下:

并生成路径线。
2、添加中心点与影响范围
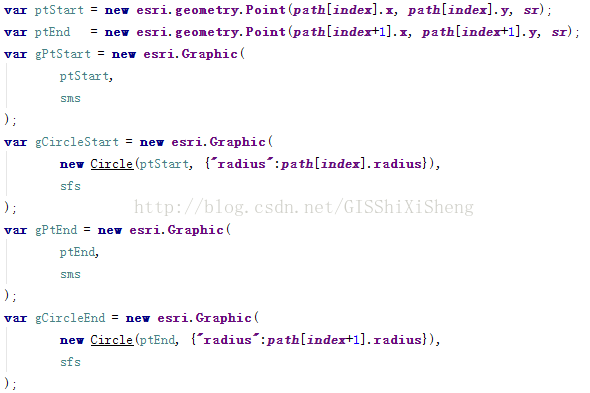
并添加到地图:
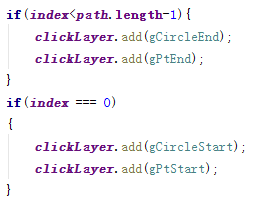
3、间隔添加

完整代码如下:
- <!DOCTYPE html>
- <html>
- <head>
- <meta http-equiv="Content-Type" content="text/html; charset=utf-8">
- <meta name="viewport" content="initial-scale=1, maximum-scale=1,user-scalable=no"/>
- <title>Simple Map</title>
- <link rel="stylesheet" href="http://localhost/arcgis_js_api/library/3.9/3.9/js/esri/css/esri.css">
- <style>
- html, body, #map {
- height: 100%;
- margin: 0;
- padding: 0;
- }
- body {
- background-color: #FFF;
- overflow: hidden;
- font-family: "Trebuchet MS";
- }
- .textss{
- position: absolute;
- right: 20px;
- top: 20px;
- border: 1px solid #C9DCD7;
- background: #bfbfbf;
- padding: 0.1em 0.3em 0.1em;
- font-size: 11px;
- border-radius: 5px;
- /*box-shadow: 0 0 0.75em #777777;*/
- }
- </style>
- <script src="http://localhost/arcgis_js_api/library/3.9/3.9/init.js"></script>
- <script>
- var drawLine = {
- "id":32,
- "name":"北京",
- "X":116.068276,
- "Y":39.892225,
- endPt:[{"id":1,"name":"乌鲁木齐","X":87.575829,"Y":43.782212},
- {"id":2,"name":"拉萨","X":91.162998,"Y":29.71042},
- {"id":3,"name":"西宁","X":101.797303,"Y":36.593642},
- {"id":4,"name":"兰州","X":103.584297,"Y":36.119086}/*,
- {"id":5,"name":"成都","X":104.035508,"Y":30.714179},
- {"id":6,"name":"重庆","X":106.519115,"Y":29.478925},
- {"id":7,"name":"贵阳","X":106.668071,"Y":26.457312},
- {"id":8,"name":"昆明","X":102.726775,"Y":24.969385},
- {"id":9,"name":"银川","X":106.167225,"Y":38.598524},
- {"id":10,"name":"西安","X":108.967128,"Y":34.276112},
- {"id":11,"name":"南宁","X":108.233931,"Y":22.748296},
- {"id":12,"name":"海口","X":110.346181,"Y":19.96992},
- {"id":13,"name":"广州","X":113.226683,"Y":23.18307},
- {"id":14,"name":"长沙","X":112.947928,"Y":28.169916},
- {"id":15,"name":"南昌","X":115.893715,"Y":28.652363},
- {"id":16,"name":"福州","X":119.246768,"Y":26.070765},
- {"id":17,"name":"台北","X":121.503567,"Y":25.008274},
- {"id":18,"name":"杭州","X":120.183046,"Y":30.330584},
- {"id":19,"name":"上海","X":121.449707,"Y":31.253361},
- {"id":20,"name":"武汉","X":114.216597,"Y":30.579253},
- {"id":21,"name":"合肥","X":117.262302,"Y":31.838353},
- {"id":22,"name":"南京","X":118.805692,"Y":32.085022},
- {"id":23,"name":"郑州","X":113.6511,"Y":34.746308},
- {"id":24,"name":"济南","X":117.048331,"Y":36.60841},
- {"id":25,"name":"石家","X":114.478215,"Y":38.033276},
- {"id":26,"name":"太原","X":112.483066,"Y":37.798404},
- {"id":27,"name":"呼和浩特","X":111.842806,"Y":40.895751},
- {"id":28,"name":"天津","X":117.351094,"Y":38.925719},
- {"id":29,"name":"沈阳","X":123.296299,"Y":41.801604},
- {"id":30,"name":"长春","X":125.26142,"Y":43.981984},
- {"id":31,"name":"哈尔","X":126.567138,"Y":45.69381},
- {"id":33,"name":"香港","X":114.093117,"Y":22.427852},
- {"id":34,"name":"澳门","X":113.552482,"Y":22.184495}*/
- ]
- };
- var path = [
- {"id":1, "x":120.49357, "y":44.883323, "radius":100000},
- {"id":2, "x":117.9872, "y":42.350326, "radius":80000},
- {"id":3, "x":115.545833, "y":39.79259, "radius":120000},
- {"id":4, "x":113.508521, "y":38.274465, "radius":40000},
- {"id":5, "x":110.551524, "y":37.151942, "radius":150000},
- {"id":6, "x":108.67448, "y":36.30474, "radius":110000},
- {"id":7, "x":106.491804, "y":36.264706, "radius":130000},
- {"id":8, "x":102.495929 ,"y":37.07025, "radius":140000},
- {"id":9, "x":98.093644, "y":38.784154, "radius":160000},
- {"id":10, "x":92.640902, "y":39.126654, "radius":170000},
- {"id":11, "x":91.005868, "y":38.125725, "radius":160000},
- {"id":12, "x":90.545122, "y":34.951701, "radius":130000},
- {"id":13, "x":91.309324, "y":33.32037, "radius":100000},
- {"id":14, "x":93.411982, "y":31.777678, "radius":150000},
- {"id":15, "x":98.224212, "y":30.395442, "radius":170000},
- {"id":16, "x":100.630326, "y":29.013206, "radius":180000},
- {"id":17, "x":101.171328, "y":27.058946, "radius":190000},
- {"id":18, "x":104.454919, "y":25.907586, "radius":190000},
- {"id":19, "x":108.053446, "y":26.965449, "radius":20000},
- {"id":20, "x":113.019257, "y":28.194103, "radius":130000},
- {"id":21, "x":116.535467, "y":26.871059, "radius":110000},
- {"id":22, "x":117.470083, "y":23.943192, "radius":100000}];
- var map, clickLayer,sr;
- var index = 0,t=0;
- require([
- "esri/map",
- "esri/layers/ArcGISTiledMapServiceLayer",
- "esri/layers/GraphicsLayer",
- "esri/symbols/PictureMarkerSymbol",
- "esri/symbols/SimpleLineSymbol", //简单线符号
- "dojo/_base/Color",
- "dojo/on",
- "dojo/dom",
- "dojo/domReady!"],
- function(Map,
- Tiled,
- GraphicsLayer,
- PictureMarkerSymbol,
- SimpleLineSymbol,
- Color,
- on,
- dom
- ) {
- map = new Map("map",{logo:false});
- var tiled = new Tiled("http://localhost:6080/arcgis/rest/services/image/MapServer",{"id":"tiled"});
- map.addLayer(tiled, 0);
- sr = map.spatialReference;
- var mapCenter = new esri.geometry.Point(103.847, 36.0473, sr);
- map.centerAndZoom(mapCenter);
- clickLayer = new GraphicsLayer({"id":"clickLayer"});
- map.addLayer(clickLayer);
- var popupLayer = new GraphicsLayer({"id":"popupLayer"});
- map.addLayer(popupLayer, 2);
- map.on("load",function(){
- addReadPopup(drawLine);
- });
- function addReadPopup(data){
- var pms = new PictureMarkerSymbol('images/red.png', 14, 16);
- var pt=new esri.geometry.Point(data.X,data.Y,sr);
- var graphic = new esri.Graphic(pt, pms, data);
- popupLayer.add(graphic);
- };
- popupLayer.on("click",popupLayerClick);
- popupLayer.on("mouse-over",popupLayerOver);
- popupLayer.on("mouse-out",popupLayerOut);
- function popupLayerClick(evt){
- clickLayer.clear();
- var graphic = evt.graphic;
- console.log(graphic);
- map.infoWindow.setTitle(graphic.attributes.name);
- map.infoWindow.setContent(graphic.attributes.name);
- map.infoWindow.show(graphic.geometry);
- var endPts = graphic.attributes.endPt;
- var lines = new Array();
- for(var i= 0,dl=endPts.length;i<dl;i++){
- var endPt = endPts[i];
- var pms = new PictureMarkerSymbol('images/house.png', 30, 30);
- var pt=new esri.geometry.Point(endPt.X,endPt.Y,sr);
- var ptGraphic = new esri.Graphic(pt, pms, endPt);
- popupLayer.add(ptGraphic);
- lines.push([graphic.attributes.X,graphic.attributes.Y],[endPt.X,endPt.Y]);
- }
- var lineJson={
- "paths":[lines],
- "spatialReference":{"wkid":4326}
- };
- var line = new esri.geometry.Polyline(lineJson);
- var sls = new SimpleLineSymbol(SimpleLineSymbol.STYLE_SOLID,
- new Color([0, 255, 0]),
- 2
- );
- var lineGraphic = new esri.Graphic(line, sls , endPt);
- clickLayer.add(lineGraphic);
- map.setExtent(line.getExtent().expand(2));
- }
- function popupLayerOver(e){
- map.setMapCursor("pointer");
- console.log(e.graphic.attributes);
- var scrPt = map.toScreen(e.graphic.geometry);
- var textDiv = dojo.doc.createElement("div");
- dojo.attr(textDiv,{
- "id":"text"
- });
- dojo.style(textDiv, {
- "left": scrPt.x+10 + "px",
- "top": scrPt.y+10 + "px",
- "position": "absolute",
- "z-index":99,
- "background":"#fcffd1",
- "font-size":"10px",
- "border":"1px solid #0096ff",
- "padding": "0.1em 0.3em 0.1em",
- "font-size": "11px",
- "border-radius": "3px",
- "box-shadow": "0 0 0.75em #777777"
- });
- textDiv.innerHTML =e.graphic.attributes.name+"市水利自动化研究所";
- dojo.byId("map").appendChild(textDiv);
- };
- function popupLayerOut(e){
- map.setMapCursor("default");
- dojo.byId("map").removeChild(dojo.byId("text"));
- };
- on(dom.byId("addPath"), "click", function(){
- console.log(path);
- addPath();
- });
- });
- function addPath(){
- require([
- "esri/geometry/Circle"
- ],
- function(Circle){
- console.log(index);
- var sms = new esri.symbol.SimpleMarkerSymbol({
- "color": [255,255,0,255],
- "size": 8,
- "angle": -30,
- "xoffset": 0,
- "yoffset": 0,
- "type": "esriSMS",
- "style": "esriSMSCircle",
- "outline": {
- "color": [255,0,0,255],
- "width": 1,
- "type": "esriSLS",
- "style": "esriSLSSolid"
- }
- });
- var sls = new esri.symbol.SimpleLineSymbol(esri.symbol.SimpleLineSymbol.STYLE_SOLID,
- new esri.Color([255, 0, 0]),
- 2
- );
- var sfs = new esri.symbol.SimpleFillSymbol(esri.symbol.SimpleFillSymbol.STYLE_SOLID,
- new esri.symbol.SimpleLineSymbol(esri.symbol.SimpleLineSymbol.STYLE_DASHDOT,
- new esri.Color([0,0,255,0.2]), 2),new esri.Color([0,0,255,0.2])
- );
- var ptStart = new esri.geometry.Point(path[index].x, path[index].y, sr);
- var ptEnd = new esri.geometry.Point(path[index+1].x, path[index+1].y, sr);
- var gPtStart = new esri.Graphic(
- ptStart,
- sms
- );
- var gCircleStart = new esri.Graphic(
- new Circle(ptStart, {"radius":path[index].radius}),
- sfs
- );
- var gPtEnd = new esri.Graphic(
- ptEnd,
- sms
- );
- var gCircleEnd = new esri.Graphic(
- new Circle(ptEnd, {"radius":path[index+1].radius}),
- sfs
- );
- var polylineJson = {
- "paths":[[[path[index].x,path[index].y], [path[index+1].x,path[index+1].y]]],
- "spatialReference":{"wkid":4326}
- };
- var gLine = new esri.Graphic(
- new esri.geometry.Polyline(polylineJson),
- sls
- );
- clickLayer.add(gLine);
- if(index<path.length-1){
- clickLayer.add(gCircleEnd);
- clickLayer.add(gPtEnd);
- }
- if(index === 0)
- {
- clickLayer.add(gCircleStart);
- clickLayer.add(gPtStart);
- }
- if(index<path.length-2){
- t = setTimeout('addPath()',1000);
- index++;
- }
- else{
- clearInterval(t);
- }
- });
- }
- </script>
- </head>
- <body>
- <div id="map">
- <button id="addPath" type="button" style="position: absolute; top: 10pt; right: 15pt; z-index: 99;">添加路径</button>
- </div>
- </body>
- </html>