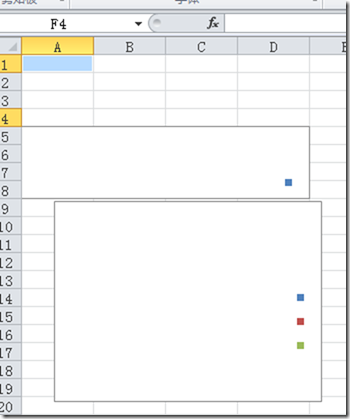
以编程方式将 Chart 控件添加到工作表中
-
1.在 Sheet1 的 Startup 事件处理程序中,插入以下代码以添加 Chart 控件。在“Sheet1.cs”文件中的“Sheet1_Startup”事件中运行
Microsoft.Office.Tools.Excel.Chart employeeData;
employeeData = this.Controls.AddChart(25, 110, 200, 150, "employees");
employeeData.ChartType = Excel.XlChartType.xl3DPie;
// Gets the cells that define the data to be charted.
Excel.Range chartRange = this.get_Range("A5", "D8");
employeeData.SetSourceData(chartRange, missing); -
2.下面的代码生成一个基于打开的工作表的工作表宿主项,然后添加一个 Chart 控件。在“ThisWorkbook.cs”文件的”ThisWorkbook_Startup”事件中运行。
-
private void AddChart() {
-
// Use the following line of code in projects that target the .NET Framework 4. Worksheet worksheet = Globals.Factory.GetVstoObject( Globals.ThisAddIn.Application.ActiveWorkbook.ActiveSheet);
-
// In projects that target the .NET Framework 3.5, use the following line of code.
-
// Worksheet worksheet =
-
// ((Excel.Worksheet)Globals.ThisAddIn.Application.ActiveWorkbook.ActiveSheet).GetVstoObject();
-
Excel.Range cells = worksheet.Range["A5", "D8"];
-
Chart chart = worksheet.Controls.AddChart(cells, "employees");
-
chart.ChartType = Microsoft.Office.Interop.Excel.XlChartType.xl3DPie;
-
chart.SetSourceData(cells, missing);
-
}
