来源于手册
Workflow Steps to Identify and Analyze Hotspots
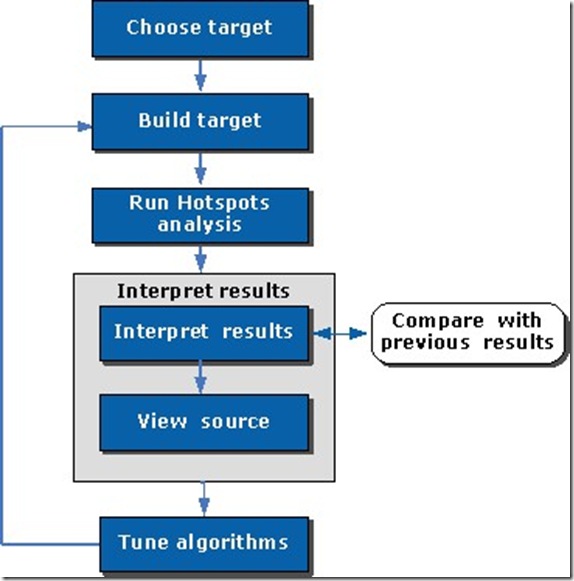
You can use the Intel® VTune™ Amplifier XE to identify and analyze hotspot functions in your serial or parallel application by performing a series of steps in a workflow. This tutorial guides you through these workflow steps while using a sample ray-tracer application named tachyon.
- Choose a target to analyze for hotspots.
- Configure environment and project settings and build your target.
- Choose and run the Hotspots analysis.
- Interpret the result data.
- View and analyze code of the performance-critical function.
- Modify the code to tune the algorithms or rebuild the code with Intel® Compiler.
66:这里的工程从 开发包里 解压而出
Build Target
After choosing the analysis target, do the following to ensure the Intel® VTune™ Amplifier XE provides the most accurate information on the performance of your application:
NOTE
The steps below are provided for Microsoft Visual Studio 2005. They may differ slightly for other versions of Visual Studio.
Enable Downloading the Debug Information for System Libraries
- Go to Tools > Options....
The Options dialog box opens. - From the left pane, select Debugging > Symbols.
- In the Symbol file (.pdb) locations field, click the button and specify the following address: http://msdl.microsoft.com/download/symbols.
- Make sure the added address is checked.
- In the Cache symbols from symbol servers to this directory field, specify a directory where the downloaded symbol files will be stored.
- For Microsoft Visual Studio* 2005, check the Load symbols using the updated settings when this dialog is closed box.
- Click OK.
Enable Generating Debug Information for Your Binary Files
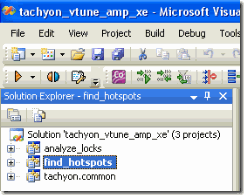
- Select the find_hotspots project and go to Project > Properties.
- From the find_hotspots Property Pages dialog box, select Configuration Properties > General and make sure the selected Configuration (top of the dialog) is Active(Release).
- From the find_hotspots Property Pages dialog box, select C/C++ > General pane and specify the Debug Information Format as Program Database (/Zi).
- From the find_hotspots Property Pages dialog box, select Linker > Debugging and set the Generate Debug Info option to Yes (/DEBUG).
Choose a Build Mode and Build a Target
- Go to the Build > Configuration Manager... dialog box and select the Release mode for your target project.
- From the Visual Studio menu, select Build > Build find_hotspots.
The tachyon_find_hotspots.exe application is built.
NOTE
The build configuration for tachyon may initially be set to Debug, which is typically used for development. When analyzing performance issues with the VTune Amplifier XE, you are recommended to use the Release build with normal optimizations. In this way, the VTune Amplifier XE is able to analyze the realistic performance of your application.
Create a Performance Baseline
- From the Visual Studio menu, select Debug > Start Without Debugging.
The tachyon_find_hotspots.exe application starts running.
NOTE
Run Hotspots Analysis
In this tutorial, you run the Hotspots analysis to identify the hotspots that took much time to execute.
最重要的地方
Interpret Result Data
When the sample application exits, the Intel® VTune™ Amplifier XE finalizes the results and opens the Hotspots viewpoint that consists of the Summary, Bottom-up, and Top-down Tree windows. To interpret the data on the sample code performance, do the following:
- Understand the basic performance metrics provided by the Hotspots analysis.
- Analyze the most time-consuming functions.
- Analyze CPU usage per function.
NOTE
The screenshots and execution time data provided in this tutorial are created on a system with four CPU cores. Your data may vary depending on the number and type of CPU cores on your system.
Understand the Basic Hotspots Metrics
Start analysis with the Summary window. To interpret the data, hover over the question mark icons
to read the pop-up help and better understand what each performance metric means.
| Note that CPU Time for the sample application is equal to 64.907 seconds. It is the sum of CPU time for all application threads. Total Thread Count is 3, so the sample application is multi-threaded. | |
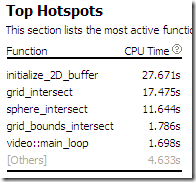
| The Top Hotspots section provides data on the most time-consuming functions (hotspot functions) sorted by CPU time spent on their execution. For the sample application, the initialize_2D_buffer function, which took 27.671 seconds to execute, shows up at the top of the list as the hottest function. The [Others] entry at the bottom shows the sum of CPU time for all functions not listed in the table. |
Analyze the Most Time-consuming Functions
Click the Bottom-up tab to explore the Bottom-up pane. By default, the data in the grid is sorted by Function. You may change the grouping level using the Grouping drop-down menu at the top of the grid.
Analyze the CPU Time column values. This column is marked with a yellow star as the Data of Interest column. It means that the VTune Amplifier XE uses this type of data for some calculations (for example, filtering, stack contribution, and others). Functions that took most CPU time to execute are listed on top.
The initialize_2D_buffer function took 27.671 seconds to execute. Click the plus sign
at the initialize_2D_buffer function to expand the stacks calling this function. You see that it was called only by the setup_2D_buffer function.
源于buttom up
是不是按照第一个排序,就是 按照时间的顺序进行优化了啦?
Select the initialize_2D_buffer function in the grid and explore the data provided in the Call
Stack pane on the right.
The Call Stack pane displays full stack data for each hotspot function, enables you to navigate between function call stacks and understand the impact of each stack to the function CPU time. The stack functions in the Call Stack pane are represented in the following format:
<module>!<function> - <file>:<line number>, where the line number corresponds to the line calling the next function in the stack.
For the sample application, the hottest function initialize_2D_buffer is called at line 86 of the setup_2D_buffer function in the global.cpp file.
Analyze CPU Usage per Function
| VTune Amplifier XE enables you to analyze the collected data from different perspectives by using multiple viewpoints.
For the Hotspots analysis result, you may switch to the Hotspots by CPU Usage viewpoint to understand how your hotspot function performs in terms of the CPU usage. Explore this viewpoint to determine how your application utilized available cores and identify the most serial code.
| |
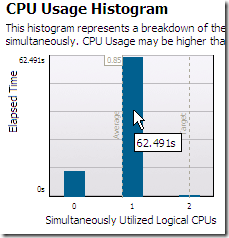
| If you go back to the Summary window, you can see the CPU Usage Histogram that represents the Elapsed time and usage level for the available logical processors. Ideally, the highest bar of your chart should match the Target level. The tachyon_find_hotspots application ran mostly on one logical CPU. If you hover over the highest bar, you see that it spent 62.491 seconds using one core only, which is classified by the VTune Amplifier XE as a Poor utilization for a dual-core system. To understand what prevented the application from using all available logical CPUs effectively, explore the Bottom-up pane. | |
| To get the detailed CPU usage information per function, use the
( where??)
button in the Bottom-up window to expand the CPU Time column. Note that initialize_2D_buffer is the function with the longest poor CPU utilization (red bars). This means that the processor cores were underutilized most of the time spent on executing this function.
|
|
|
|
|
If you change the grouping level (highlighted in the figure above) in the Bottom-up pane from Function/Call Stack to Thread/Function/Call Stack, you see that the initialize_2D_buffer function belongs to the thread_video thread. This thread is also identified as a hotspot and shows up at the top in the Bottom-up pane. To get detailed information on the hotspot thread performance, explore the Timeline pane
.
| Timeline area. When you hover over the graph element, the timeline tooltip displays the time passed since the application has been launched. | |
| Threads area that shows the distribution of CPU time utilization per thread. Hover over a bar to see the CPU time utilization in percent for this thread at each moment of time. Green zones show the time threads are active. | |
| CPU Usage area that shows the distribution of CPU time utilization for the whole application. Hover over a bar to see the application-level CPU time utilization in percent at each moment of time. VTune Amplifier XE calculates the overall CPU Usage metric as the sum of CPU time per each thread of the Threads area. Maximum CPU Usage value is equal to [number of processor cores] x 100%.
|
The Timeline analysis also identifies the thread_video thread as the most active. The tooltip shows that CPU time values rarely exceed 100% whereas the maximum CPU time value for dual-core systems is 200%. This means that the processor cores were half-utilized for most of the time spent on executing the tachyon_find_hotspots application.
Recap
You identified a function that took the most CPU time and could be a good candidate for algorithm tuning.
Analyze Code
You identified initialize_2D_buffer as the hottest function. In the Bottom-up pane, double-click this function to open the Source window and analyze the source code:
- Understand basic options provided in the Source window.
- Identify the hottest code lines.
66 是不是单击第一个打开函数堆栈,双击点开代码??
Understand Basic Source Window Options
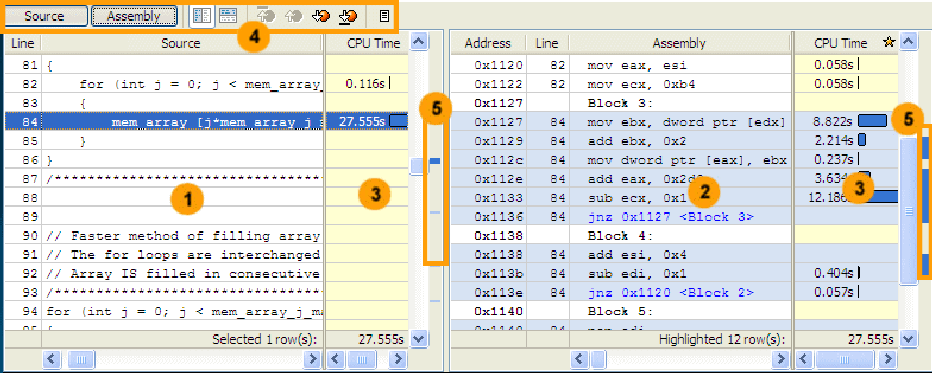
The table below explains some of the features available in the Source window when viewing the Hotspots analysis data.
| Source pane displaying the source code of the application if the function symbol information is available. The code line that took the most CPU time to execute is highlighted. The source code in the Source pane is not editable. If the function symbol information is not available, the Assembly pane opens displaying assembler instructions for the selected hotspot function. To enable the Source pane, make sure tobuild the target properly.
| |
| Assembly pane displaying the assembler instructions for the selected hotspot function. Assembler instructions are grouped by basic blocks. The assembler instructions for the selected hotspot function are highlighted. To get help on an assembler instruction, right-click the instruction and select Instruction Reference. NOTE To get the help on a particular instruction, make sure to have the Adobe* Acrobat Reader* 9 (or later) installed. If an earlier version of the Adobe Acrobat Reader is installed, the Instruction Reference opens but you need to locate the help on each instruction manually. | |
| Processor time attributed to a particular code line. If the hotspot is a system function, its time, by default, is attributed to the user function that called this system function.
| |
| Source window toolbar. Use the hotspot navigation buttons to switch between most performance-critical code lines. Hotspot navigation is based on the metric column selected as a Data of Interest. For the Hotspots analysis, this is CPU Time. Use the Source/Assembly buttons to toggle the Source/Assembly panes (if both of them are available) on/off.
| |
| Heat map markers to quickly identify performance-critical code lines (hotspots). The bright blue markers indicate hot lines for the function you selected for analysis. Light blue markers indicate hot lines for other functions. Scroll to a marker to locate the hot code line it identifies. | |
|
| 这里可以直接看到最大的消耗,看第5步骤 |
Tune Algorithms
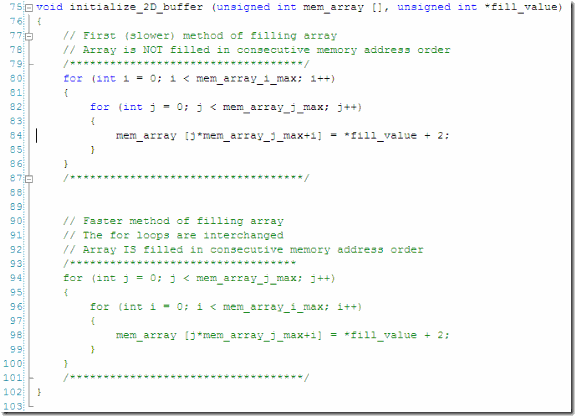
In the Source window, you identified that in the initialize_2D_buffer hotspot function the code line 84 took the most CPU time. Focus on this line and do the following:
- Open the code editor.
- Resolve the performance problem using any of these options:
Open the Code Editor
In the Source window, click the
Source Editor button to open the find_hotspots.cpp file in the default code editor at the hotspot line:
66 作者举的例子是:赋值的时候,地址对齐与否啊。。。呵呵
Hotspot line 84 is used to initialize a memory array using non-sequential memory locations. For demonstration purposes, the code lines are commented as a slower method of filling the array.
Resolve the Problem
To resolve this issue, use one of the following methods:
Option 1: Optimize your algorithm
- Edit line 79 to comment out code lines 82-88 marked as a "First (slower) method".
- Edit line 95 to uncomment code lines 98-104 marked as a "Faster method".
In this step, you interchange the for loops to initialize the code in sequential memory locations.
- From the Visual Studio menu, select Build > Rebuild find_hotspots.
The project is rebuilt.
- From Visual Studio Debug menu, select Start Without Debugging to run the application.
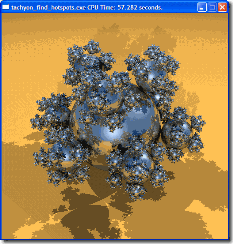
Visual Studio runs the tachyon_find_hotspots.exe. Note that execution time has reduced from 63.609 seconds to 57.282 seconds.
Option 2: Recompile the code with Intel® Compiler
This option assumes that you have Intel® Composer XE installed. Composer XE is part of Intel® Parallel Studio XE. By default, the Intel® Compiler, one of the Composer components, uses powerful optimization switches, which typically provides some gain in performance. For more details on the Intel compiler, see the Intel Composer documentation.
As an alternative, you may consider running the default Microsoft Visual Studio compiler applying more aggressive optimization switches.
To recompile the code with the Intel compiler:
- From Visual Studio Project menu, select Intel Composer XE> Use Intel C++....
- In the Confirmation window, click OK to confirm your choice.
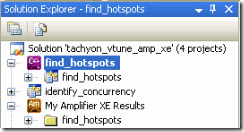
The project in Solution Explorer appears with the ComposerXE icon:
- From the Visual Studio menu, select Build > Rebuild find_hotspots.
The project is rebuilt with the Intel compiler.
- From the Visual Studio menu, select Debug > Start Without Debugging.
Visual Studio runs the tachyon_find_hotspots.exe. Note that the execution time reduced.
