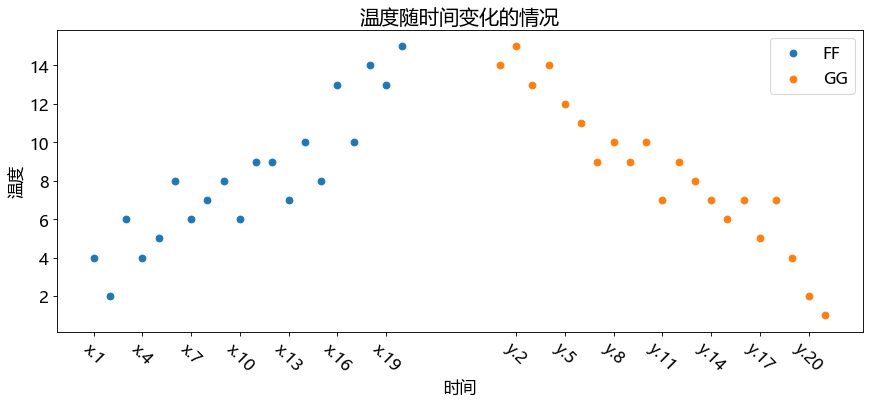
散点图
# -*- coding: utf-8 -*-
from matplotlib import pyplot as plt
import random
from pylab import mpl
mpl.rcParams['font.sans-serif']=['SimHei']

y_1 = [4,2,6,4,5,8,6,7,8,6,9,9,7,10,8,13,10,14,13,15]
y_2 = [14,15,13,14,12,11,9,10,9,10,7,9,8,7,6,7,5,7,4,2,1]
x_1 = range(1,21)
x_2 = range(26,47)

# 设置图片大小
plt.figure(figsize=(13,5),dpi=80)

# 使用scatter绘制散点图
plt.scatter(x_1,y_1,label="FF")
plt.scatter(x_2,y_2,label="GG")

# 调整x轴刻度
_x = list(x_1)+list(x_2)
_xtick_lables = ["x.{}".format(i) for i in x_1]
_xtick_lables += ["y.{}".format(i-25) for i in x_2]
plt.xticks(_x[::3],_xtick_lables[::3],rotation=-45)

# 添加图例
plt.legend(loc="upper right")

# 添加描述信息
plt.xlabel("时间")
plt.ylabel("温度")
plt.title("温度随时间变化的情况")

# 展示
plt.show()
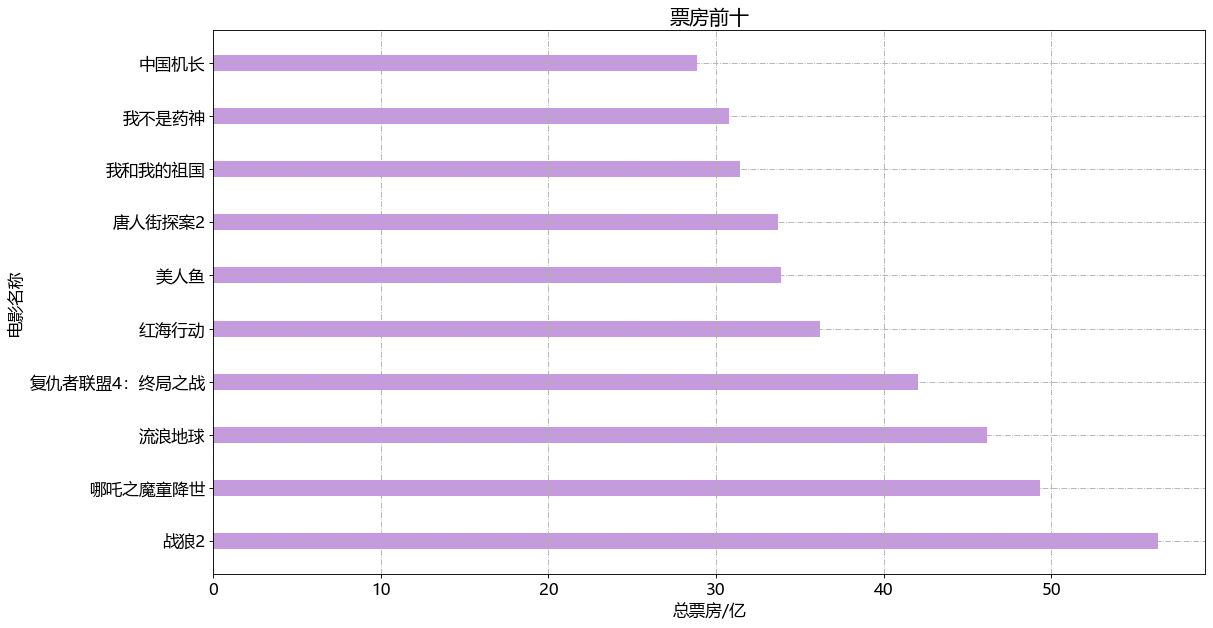
条形图
a = ["战狼2","哪吒之魔童降世","流浪地球","复仇者联盟4:终局之战","红海行动","美人鱼","唐人街探案2","我和我的祖国","我不是药神","中国机长"]
b = [56.39,49.34,46.18,42.05,36.22,33.9,33.71,31.46,30.75,28.84]
# -*- coding: utf-8 -*-
from matplotlib import pyplot as plt

# 字体修改样式
from pylab import mpl
mpl.rcParams['font.sans-serif']=['SimHei']

a = ["战狼2","哪吒之魔童降世","流浪地球","复仇者联盟4:终局之战","红海行动","美人鱼","唐人街探案2","我和我的祖国","我不是药神","中国机长"]
b = [56.39,49.34,46.18,42.05,36.22,33.9,33.71,31.46,30.75,28.84]

# 设置图片大小
plt.figure(figsize=(16,9),dpi=80)

# # 绘制1 名称会有重叠
# plt.bar(range(len(a)),b)
# # x轴刻度
# plt.xticks(range(len(a)),a)

# 绘制2 横着
plt.barh(range(len(a)),b,height=0.3,color="#c59adf")
# x轴刻度
plt.yticks(range(len(a)),a)

# 添加描述信息
plt.xlabel("总票房/亿")
plt.ylabel("电影名称")
plt.title("票房前十")

# 绘制网格
plt.grid(linestyle="-.")

# 展示
plt.show()
电源名称=[战狼2,哪吒之魔童降世,流浪地球,复仇者联盟4:终局之战,红海行动,美人鱼,唐人街探案2,我和我的祖国,我不是药神,中国机长]
总票房(亿)=[56.39,49.34,46.18,42.05,36.22,33.9,33.71,31.46,30.75,28.84]
# -*- coding: utf-8 -*-
from matplotlib import pyplot as plt
# 字体修改样式
from pylab import mpl
mpl.rcParams['font.sans-serif']=['SimHei']
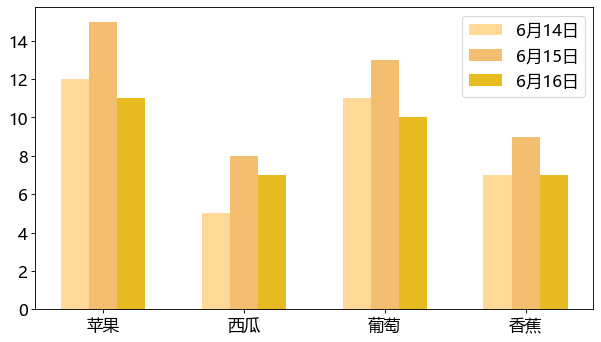
a = ["苹果","西瓜","葡萄","香蕉"]
b_1 = [12,5,11,7]
b_2 = [15,8,13,9]
b_3 = [11,7,10,7]
# 设置图片大小
plt.figure(figsize=(9,5),dpi=80)
bar_width =0.2 #条宽
# 横坐标
x_1 = list(range(len(a)))
x_2 = [i+bar_width for i in x_1]
x_3 = [i+bar_width*2 for i in x_1]
# 绘制
plt.bar(range(len(a)),b_1,width=bar_width,color="#ffd998",label="6月14日")
plt.bar(x_2,b_2,width=bar_width,color="#f3be70",label="6月15日")
plt.bar(x_3,b_3,width=bar_width,color="#e7ba21",label="6月16日")
#图例
plt.legend()
# 设置x轴刻度
plt.xticks(x_2,a)
# 展示
plt.show()
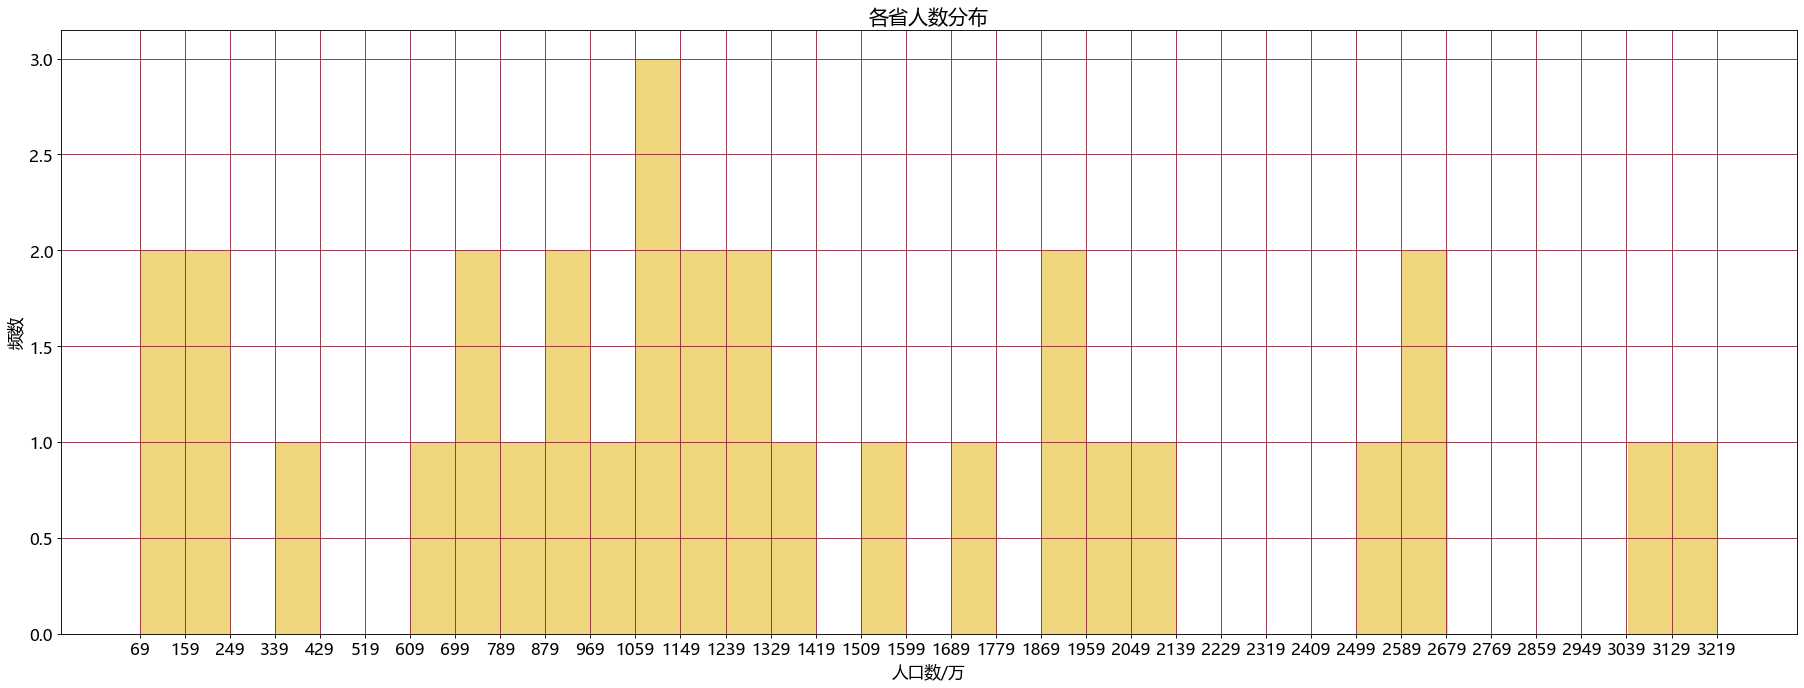
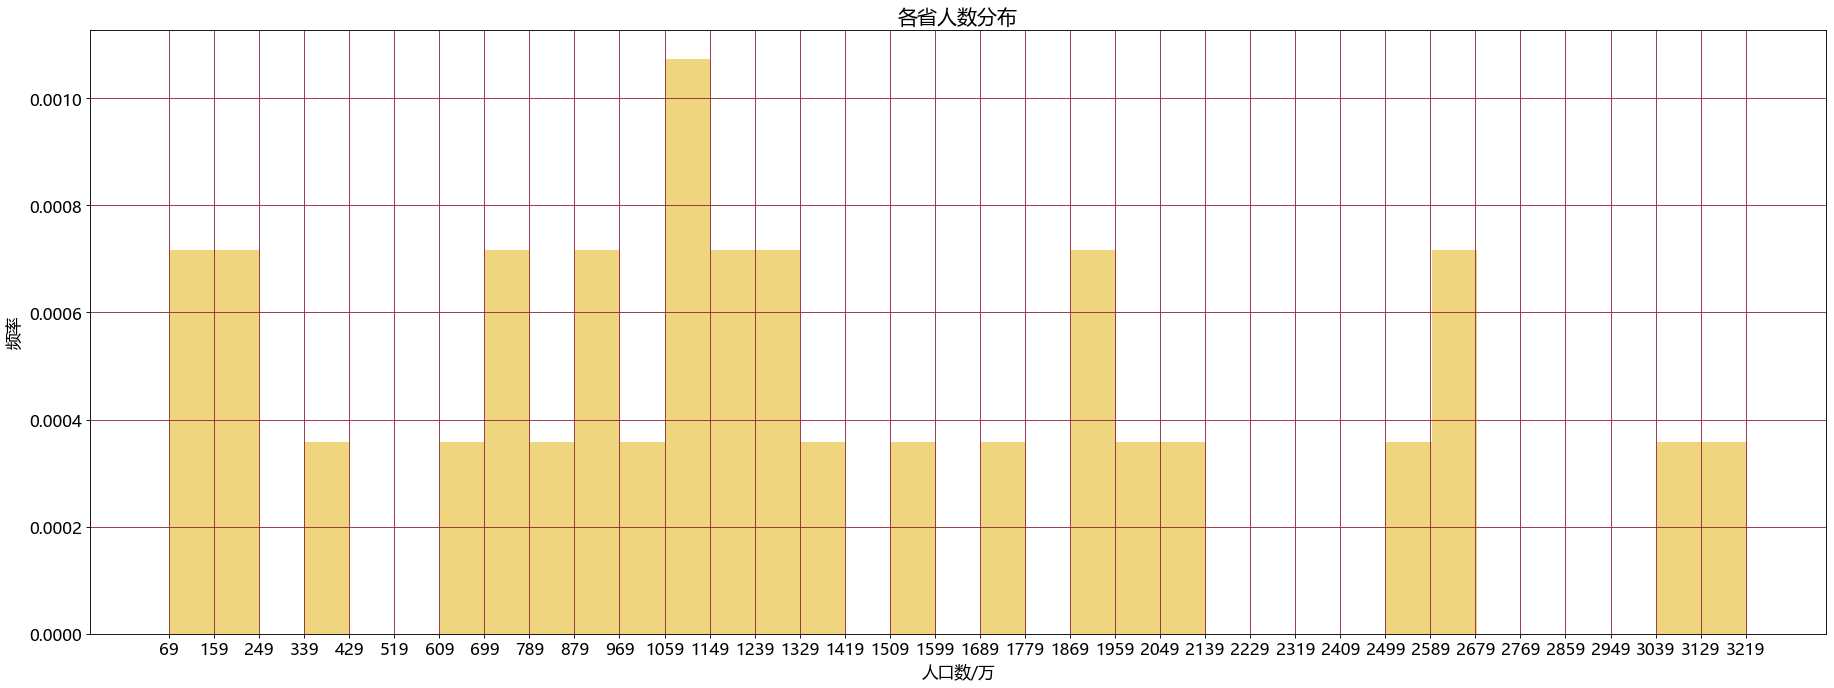
直方图
# -*- coding: utf-8 -*-
from matplotlib import pyplot as plt
#没用上 a = ["广东","山东","河南","四川","江苏","河北","浙江","安徽","湖南","湖北","辽宁","广西","黑龙江","云南","福建","江西","陕西","贵州","山西","重庆","吉林","上海","内蒙古","北京","甘肃","新疆","天津","海南","宁夏","青海","西藏"]
b = [3222 ,3079 ,2640 ,2638 ,2564 ,2081 ,2006 ,1932 ,1903 ,1725 ,1533 ,1347 ,1319 ,1270 ,1197 ,1185 ,1108 ,1075 ,1065 ,1027 ,916 ,889 ,847 ,736 ,711 ,690 ,396 ,245 ,195 ,159 ,69]
# 计算组数
d =90 #组距
num_bins = (max(b)-min(b))//d  #组数
plt.figure(figsize=(28,10),dpi=80)  #设置图片大小
# plt.hist(b,num_bins,color="#efd57e")    #绘制频数直方图
plt.hist(b,num_bins,color="#efd57e",density =1)    #绘制频率直方图


plt.xticks(range(min(b),max(b),d))    #设置x轴刻度

# 添加描述性息
plt.xlabel("人口数/万")
# plt.ylabel("频数")
plt.ylabel("频率")
plt.title("各省人数分布")

plt.grid(color="#94293b") # 绘制网格

plt.show()