import numpy as np
import matplotlib.pyplot as plt

from sklearn import datasets, linear_model,svm
from sklearn.model_selection import train_test_split

def load_data_regression():
    '''
    加载用于回归问题的数据集
    '''
    diabetes = datasets.load_diabetes() #使用 scikit-learn 自带的一个糖尿病病人的数据集
    # 拆分成训练集和测试集,测试集大小为原始数据集大小的 1/4
    return train_test_split(diabetes.data,diabetes.target,test_size=0.25,random_state=0)

#支持向量机线性回归SVR模型
def test_LinearSVR(*data):
    X_train,X_test,y_train,y_test=data
    regr=svm.LinearSVR()
    regr.fit(X_train,y_train)
    print('Coefficients:%s, intercept %s'%(regr.coef_,regr.intercept_))
    print('Score: %.2f' % regr.score(X_test, y_test))

# 生成用于回归问题的数据集
X_train,X_test,y_train,y_test=load_data_regression()
# 调用 test_LinearSVR
test_LinearSVR(X_train,X_test,y_train,y_test)

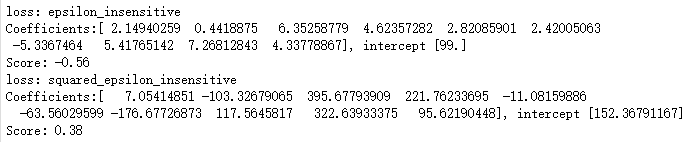
def test_LinearSVR_loss(*data):
    '''
   测试 LinearSVR 的预测性能随不同损失函数的影响
    '''
    X_train,X_test,y_train,y_test=data
    losses=['epsilon_insensitive','squared_epsilon_insensitive']
    for loss in losses:
        regr=svm.LinearSVR(loss=loss)
        regr.fit(X_train,y_train)
        print("loss:%s"%loss)
        print('Coefficients:%s, intercept %s'%(regr.coef_,regr.intercept_))
        print('Score: %.2f' % regr.score(X_test, y_test))

# 调用 test_LinearSVR_loss
test_LinearSVR_loss(X_train,X_test,y_train,y_test)
def test_LinearSVR_epsilon(*data):
    '''
    测试 LinearSVR 的预测性能随 epsilon 参数的影响
    '''
    X_train,X_test,y_train,y_test=data
    epsilons=np.logspace(-2,2)
    train_scores=[]
    test_scores=[]
    for  epsilon in  epsilons:
        regr=svm.LinearSVR(epsilon=epsilon,loss='squared_epsilon_insensitive')
        regr.fit(X_train,y_train)
        train_scores.append(regr.score(X_train, y_train))
        test_scores.append(regr.score(X_test, y_test))
    fig=plt.figure()
    ax=fig.add_subplot(1,1,1)
    ax.plot(epsilons,train_scores,label="Training score ",marker='+' )
    ax.plot(epsilons,test_scores,label= " Testing  score ",marker='o' )
    ax.set_title( "LinearSVR_epsilon ")
    ax.set_xscale("log")
    ax.set_xlabel(r"$epsilon$")
    ax.set_ylabel("score")
    ax.set_ylim(-1,1.05)
    ax.legend(loc="best",framealpha=0.5)
    plt.show()

# 调用 test_LinearSVR_epsilon
test_LinearSVR_epsilon(X_train,X_test,y_train,y_test)

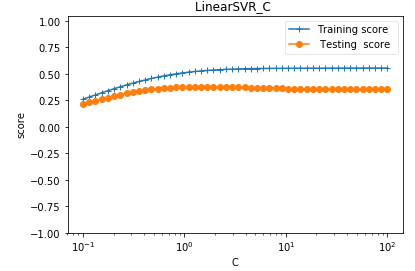
def test_LinearSVR_C(*data):
    '''
    测试 LinearSVR 的预测性能随 C 参数的影响
    '''
    X_train,X_test,y_train,y_test=data
    Cs=np.logspace(-1,2)
    train_scores=[]
    test_scores=[]
    for  C in  Cs:
        regr=svm.LinearSVR(epsilon=0.1,loss='squared_epsilon_insensitive',C=C)
        regr.fit(X_train,y_train)
        train_scores.append(regr.score(X_train, y_train))
        test_scores.append(regr.score(X_test, y_test))
    fig=plt.figure()
    ax=fig.add_subplot(1,1,1)
    ax.plot(Cs,train_scores,label="Training score ",marker='+' )
    ax.plot(Cs,test_scores,label= " Testing  score ",marker='o' )
    ax.set_title( "LinearSVR_C ")
    ax.set_xscale("log")
    ax.set_xlabel(r"C")
    ax.set_ylabel("score")
    ax.set_ylim(-1,1.05)
    ax.legend(loc="best",framealpha=0.5)
    plt.show()

# 调用 test_LinearSVR_C
test_LinearSVR_C(X_train,X_test,y_train,y_test)