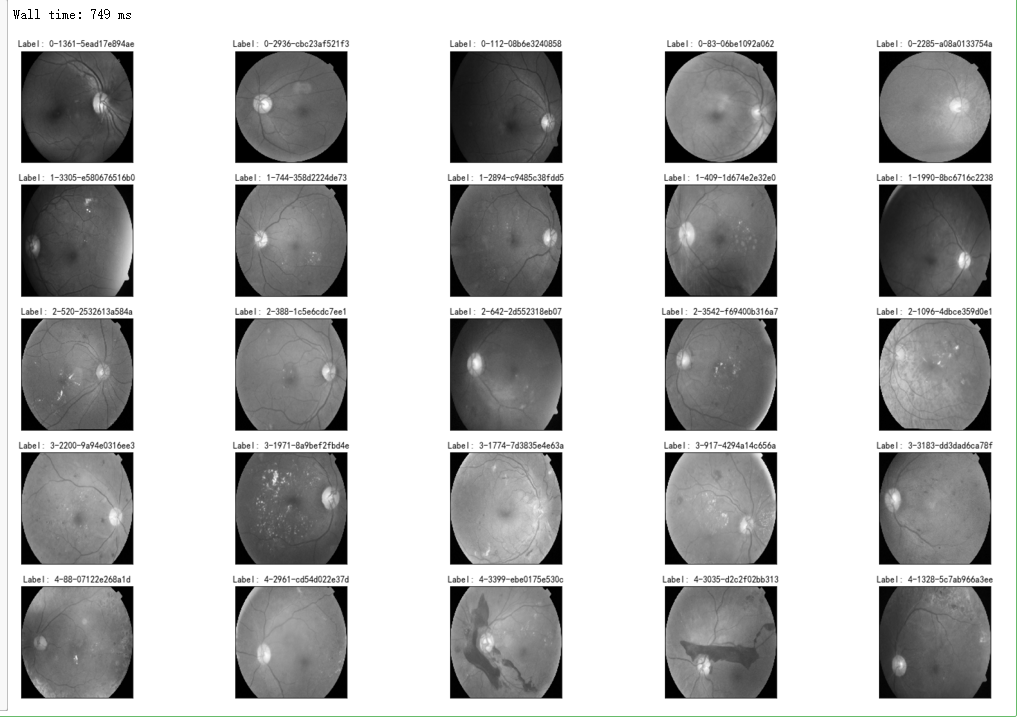
%%time
fig = plt.figure(figsize=(25, 16))
for class_id in sorted(train_y.unique()):
    for i, (idx, row) in enumerate(df_train.loc[df_train['diagnosis'] == class_id].sample(5, random_state=SEED).iterrows()):
        ax = fig.add_subplot(5, 5, class_id * 5 + i + 1, xticks=[], yticks=[])
        path="F:\kaggleDataSet\diabeticRetinopathy\resized train 19\"+str(row['id_code'])+".jpg"
        image = cv2.imread(path)
        image = cv2.cvtColor(image, cv2.COLOR_BGR2GRAY)
#         image=cv2.addWeighted ( image, 0 , cv2.GaussianBlur( image , (0 ,0 ) , 10) ,-4 ,128)
        image = cv2.resize(image, (IMG_SIZE, IMG_SIZE))
        plt.imshow(image, cmap='gray')
        ax.set_title('Label: %d-%d-%s' % (class_id, idx, row['id_code']) )
dpi = 80 #inch

# path=f"../input/aptos2019-blindness-detection/train_images/5c7ab966a3ee.png" # notice upper part
path="F:\kaggleDataSet\diabeticRetinopathy\resized train 19\cd54d022e37d.jpg" # lower-right, this still looks not so severe, can be class3
image = cv2.imread(path)
image = cv2.cvtColor(image, cv2.COLOR_BGR2GRAY)
height, width = image.shape
print(height, width)

SCALE=2
figsize = (width / float(dpi))/SCALE, (height / float(dpi))/SCALE

fig = plt.figure(figsize=figsize)
plt.imshow(image, cmap='gray')

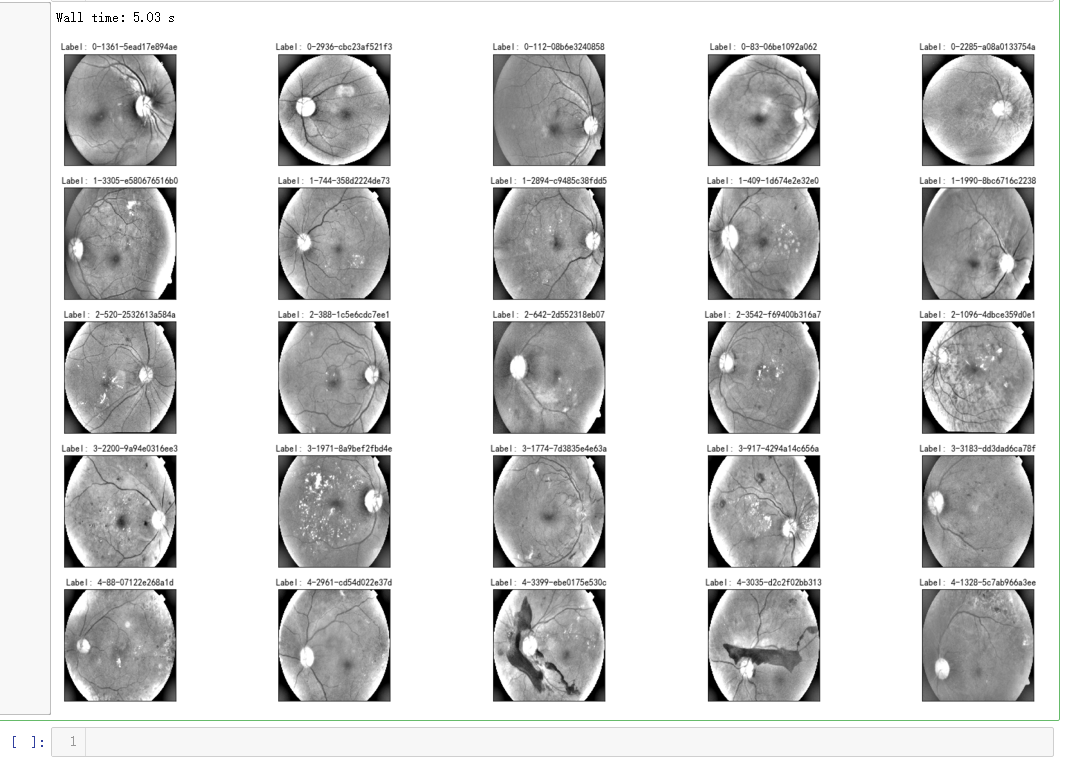
%%time
fig = plt.figure(figsize=(25, 16))
for class_id in sorted(train_y.unique()):
    for i, (idx, row) in enumerate(df_train.loc[df_train['diagnosis'] == class_id].sample(5, random_state=SEED).iterrows()):
        ax = fig.add_subplot(5, 5, class_id * 5 + i + 1, xticks=[], yticks=[])
        path="F:\kaggleDataSet\diabeticRetinopathy\resized train 19\"+str(row['id_code'])+".jpg"
        image = cv2.imread(path)
        image = cv2.cvtColor(image, cv2.COLOR_BGR2GRAY)
#         image = cv2.cvtColor(image, cv2.COLOR_BGR2RGB)
        image = cv2.resize(image, (IMG_SIZE, IMG_SIZE))
        image=cv2.addWeighted ( image,4, cv2.GaussianBlur( image , (0,0) , IMG_SIZE/10) ,-4 ,128) # the trick is to add this line

        plt.imshow(image, cmap='gray')
        ax.set_title('Label: %d-%d-%s' % (class_id, idx, row['id_code']) )
def crop_image1(img,tol=7):
    # img is image data
    # tol  is tolerance
    mask = img>tol
    return img[np.ix_(mask.any(1),mask.any(0))]

def crop_image_from_gray(img,tol=7):
    if img.ndim ==2:
        mask = img>tol
        return img[np.ix_(mask.any(1),mask.any(0))]
    elif img.ndim==3:
        gray_img = cv2.cvtColor(img, cv2.COLOR_RGB2GRAY)
        mask = gray_img>tol
        check_shape = img[:,:,0][np.ix_(mask.any(1),mask.any(0))].shape[0]
        if (check_shape == 0): # image is too dark so that we crop out everything,
            return img # return original image
        else:
            img1=img[:,:,0][np.ix_(mask.any(1),mask.any(0))]
            img2=img[:,:,1][np.ix_(mask.any(1),mask.any(0))]
            img3=img[:,:,2][np.ix_(mask.any(1),mask.any(0))]
    #         print(img1.shape,img2.shape,img3.shape)
            img = np.stack([img1,img2,img3],axis=-1)
    #         print(img.shape)
        return img
def load_ben_color(path, sigmaX=10):
    image = cv2.imread(path)
    image = cv2.cvtColor(image, cv2.COLOR_BGR2RGB)
    image = crop_image_from_gray(image)
    image = cv2.resize(image, (IMG_SIZE, IMG_SIZE))
    image=cv2.addWeighted ( image,4, cv2.GaussianBlur( image , (0,0) , sigmaX) ,-4 ,128)
    return image
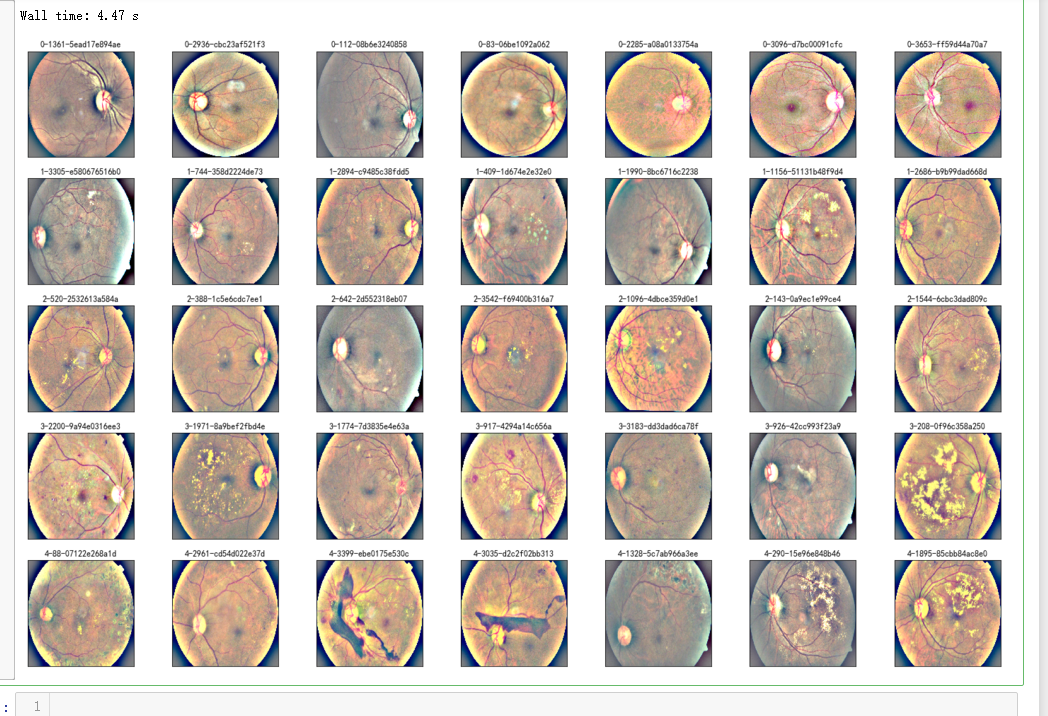
%%time

NUM_SAMP=7
fig = plt.figure(figsize=(25, 16))
for class_id in sorted(train_y.unique()):
    for i, (idx, row) in enumerate(df_train.loc[df_train['diagnosis'] == class_id].sample(NUM_SAMP, random_state=SEED).iterrows()):
        ax = fig.add_subplot(5, NUM_SAMP, class_id * NUM_SAMP + i + 1, xticks=[], yticks=[])
        path="F:\kaggleDataSet\diabeticRetinopathy\resized train 19\"+str(row['id_code'])+".jpg"
        image = load_ben_color(path,sigmaX=30)
        plt.imshow(image)
        ax.set_title('%d-%d-%s' % (class_id, idx, row['id_code']) )