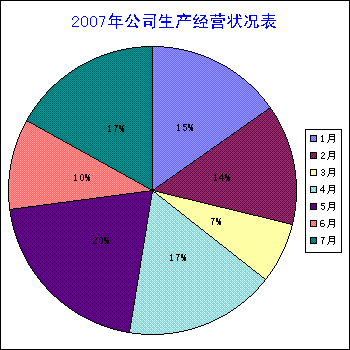
由于需要用,自己查一些资料,写的一个OWC画图表的方法,希望有用
 /// <summary>
 /// 生成图表
 /// </summary>
 /// <param name="strSeriesName">图表名称</param>
 /// <param name="strCategory">类型</param>
 /// <param name="strValue">值</param>
 /// <param name="Caption">图标标题</param>
 /// <param name="Type">类型</param>
 /// <param name="Longth">图片长</param>
 /// <param name="Width">图片宽</param>
 public string GengerateChart(string strSeriesName, string strCategory, string strValue, string Caption, string Type, int Longth, int Width)
 {
{ string chartSeriesName = strSeriesName;
 string chartCategory = strCategory;
 string chartValue = strValue;
 string chartCaption = Caption;
 string chartType = Type;
 int chartLongth = Longth;
 int chartWidth = Width;
 //创建ChartSpace对象来放置图表
 ChartSpace laySpace = new ChartSpaceClass();
 //在ChartSpace对象中添加图表
 ChChart InsertChart = laySpace.Charts.Add(0);
 switch (chartType)
 {
{ case "Pie"://饼状图
 {
{ InsertChart.Type = ChartChartTypeEnum.chChartTypePie;
 InsertChart.HasLegend = true;
 InsertChart.HasTitle = true;//为图表添加标题
 InsertChart.Title.Caption = chartCaption;//标题名称
 InsertChart.Title.Font.Color = "Blue";
 InsertChart.Title.Font.Name = "黑体";
 //指定图表是否需要图例标注
 InsertChart.HasLegend = true;

 }
} break;
 case "Line"://折线图
 {
{ InsertChart.Type = ChartChartTypeEnum.chChartTypeLine;
 //指定图表是否需要图例标注
 InsertChart.HasLegend = true;
 InsertChart.HasTitle = true;//为图表添加标题
 InsertChart.Title.Caption = chartCaption;//标题名称
 InsertChart.Title.Font.Color = "Blue";
 InsertChart.Title.Font.Name = "黑体";
 }
} break;
 case "BarClustered"://条形图
 {
{ InsertChart.Type = ChartChartTypeEnum.chChartTypeBarClustered;
 //指定图表是否需要图例标注
 InsertChart.HasLegend = true;
 InsertChart.HasTitle = true;//为图表添加标题
 InsertChart.Title.Caption = chartCaption;//标题名称
 InsertChart.Title.Font.Color = "Blue";
 InsertChart.Title.Font.Name = "黑体";
 }
} break;
 case "Area"://面积图
 {
{ InsertChart.Type = ChartChartTypeEnum.chChartTypeArea;
 //指定图表是否需要图例标注
 InsertChart.HasLegend = true;
 InsertChart.HasTitle = true;//为图表添加标题
 InsertChart.Title.Caption = chartCaption;//标题名称
 InsertChart.Title.Font.Color = "Blue";
 InsertChart.Title.Font.Name = "黑体";
 }
} break;
 }
}
 //添加一个series系列
 InsertChart.SeriesCollection.Add(0);
 //给定series系列的名字
 InsertChart.SeriesCollection[0].SetData(ChartDimensionsEnum.chDimSeriesNames, +(int)ChartSpecialDataSourcesEnum.chDataLiteral, chartSeriesName);
 //给定分类
 InsertChart.SeriesCollection[0].SetData(ChartDimensionsEnum.chDimCategories, +(int)ChartSpecialDataSourcesEnum.chDataLiteral, chartCategory);
 //给定值
//给定值 InsertChart.SeriesCollection[0].SetData(ChartDimensionsEnum.chDimValues, (int)ChartSpecialDataSourcesEnum.chDataLiteral, chartValue);
 if (chartType == "Pie")
 {
{ //增加数据值标签
 InsertChart.SeriesCollection[0].DataLabelsCollection.Add();
 InsertChart.SeriesCollection[0].DataLabelsCollection[0].HasValue = true;
 InsertChart.SeriesCollection[0].DataLabelsCollection[0].HasPercentage = true;
 }
}
 //输出文件.
 string imageName = System.DateTime.Now.ToShortDateString().Replace("-", "").Trim() + System.DateTime.Now.ToLongTimeString().Replace(":", "").Trim();
 imageName = imageName + System.DateTime.Now.Millisecond + "Chart.gif";
 string strAbsolutePath = (Server.MapPath(".")) + "\\" + imageName;
 laySpace.ExportPicture(strAbsolutePath, "GIF", chartLongth, chartWidth);
 //创建GIF文件的相对路径.
 string strRelativePath = "./" + imageName;
 //把图片添加到placeholder中,并在页面上显示
 string strImageTag = "<IMG SRC='" + strRelativePath + "'/>";
 //this.PlaceHolder1.Controls.Add(new LiteralControl(strImageTag));
 return strRelativePath;

 }
}


