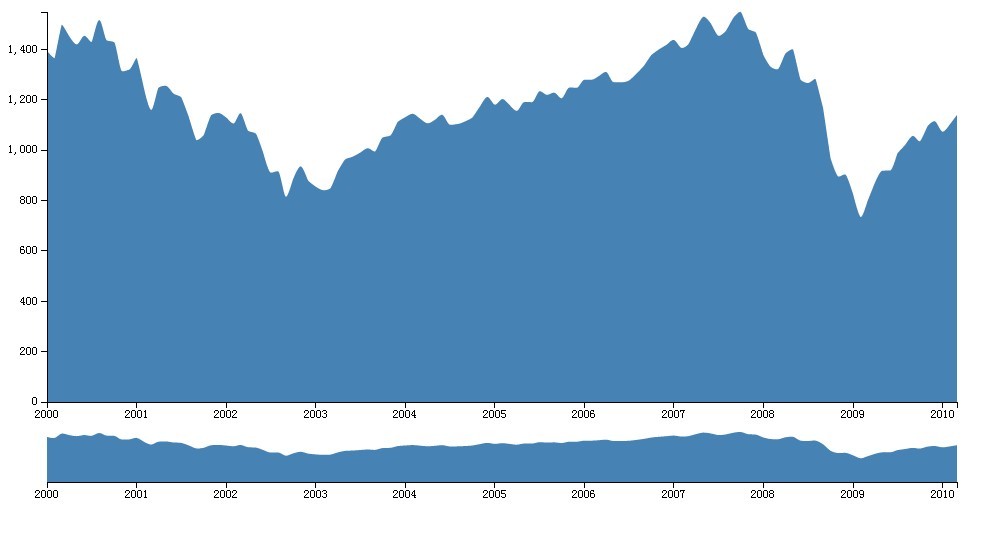
<!-- area的例子
csv使用node.js提供的 -->
<!DOCTYPE html>
<meta charset="utf-8">
<style>

svg {
  font: 10px sans-serif;
}

path {
  fill: steelblue;
}

.axis path,
.axis line {
  fill: none;
  stroke: #000;
  shape-rendering: crispEdges;
}

.brush .extent {
  stroke: #fff;
  fill-opacity: .125;
  shape-rendering: crispEdges;
}

</style>
<body>
<script src="http://d3js.org/d3.v3.min.js"></script>
<script>
var margin = {top: 10, right: 10, bottom: 100, left: 40},
    margin2 = {top: 430, right: 10, bottom: 20, left: 40},
    width = 960 - margin.left - margin.right,
    height = 500 - margin.top - margin.bottom,
    height2 = 500 - margin2.top - margin2.bottom;

var parseDate = d3.time.format("%b %Y").parse;

var x = d3.time.scale().range([0, width]),
    x2 = d3.time.scale().range([0, width]),
    y = d3.scale.linear().range([height, 0]),
    y2 = d3.scale.linear().range([height2, 0]);

var xAxis = d3.svg.axis().scale(x).orient("bottom"),
    xAxis2 = d3.svg.axis().scale(x).orient("bottom"),
    yAxis = d3.svg.axis().scale(y).orient("left");

var area=d3.svg.area()
         .interpolate("monotone")  //这里教程没有写
         .x(function(d){return x(d.date);})  //很容易写成data
         .y0(height)
         .y1(function(d){return y(d.price);})
         ;
var area2=d3.svg.area()
         .interpolate("monotone")
         .x(function(d){return x2(d.date);})
         .y0(height2)
         .y1(function(d){return y2(d.price);})
         ;

var svg=d3.select('body').append('svg')
        .attr({
         'width':width+margin.left+margin.right,
         'height':height+margin.top+margin.bottom
        })
var focus=svg.append('g')
       .attr('transform','translate('+margin.left+','+margin.top+')')
       ;
var context=svg.append('g')
       .attr('transform','translate('+margin2.left+','+margin2.top+')')
       ;

d3.csv('data.csv',function(error,data){
   data.forEach(function(d){
     d.date = parseDate(d.date);
     d.price=+d.price;
   });

 x.domain(d3.extent(data.map(function(d){return d.date;})));
 y.domain([0,d3.max(data.map(function(d){return d.price;}))]);
 x2.domain(x.domain());  //这里没有加()
 y2.domain(y.domain());

 focus.append('path')
    .datum(data)
    .attr('d',area)
    ;
 focus.append('g')
    .attr('class','x axis')
    .attr('transform','translate(0,'+height+')')
    .call(xAxis)
    ;
 focus.append('g')
    .attr('class','y axis')
    .call(yAxis)
    ;

 context.append('path')
    .datum(data)
    .attr('d',area2)
    ;
 context.append('g')
    .attr('class','x axis')
    .attr('transform','translate(0,'+height2+')')
    .call(xAxis2)
    ;
});

</script>

