效果
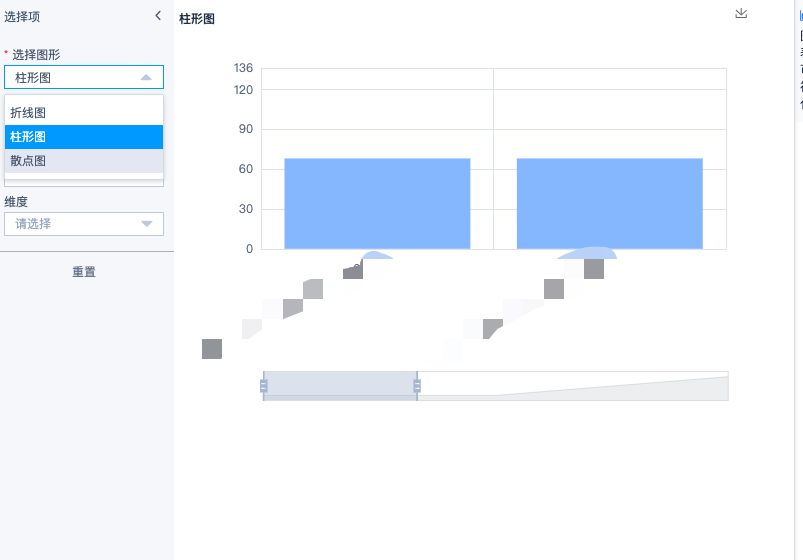
我封装的一个组件折线图,都可以多维度展示,
HTML
<div :class="'echarts-type ' + (currentVisible ? 'visible' : 'hidden')"    >
		<div class="echarts-type-left" :style="{leftWidth + 'px'}">
			<div class="echarts-expand"  v-show="expandFlag">
				<div class="fexpand">
					<div class="rowa-title" @click="expandBtn2">
						<span>选择项</span>
						<span> <i class="uex-icon-arrow-left"></i></span>
					</div>
					<div class="rowa-content">
						<el-form ref="elForm" :model="echartsForm" :rules="echartsRules" class="echarts-form">
							<el-form-item  label="选择图形" prop="type">
								<el-select v-model="echartsForm.type" @change="handelEechartsType('type',echartsForm.type)">
									<el-option v-for="option in echartsTypes" :key="option" :label="option.label" :value="option.type" ></el-option>
								</el-select>
							</el-form-item>
								<el-form-item  label="X轴值" prop="xAxis">
									<el-select v-model="echartsForm.xAxis" @change="handelEecharts('xAxis',echartsForm.xAxis)">
										<el-option v-for="option in tableHeadeData" :key="option" :label="option.label" :value="option.type" ></el-option>
									</el-select>
								</el-form-item>
								<el-form-item  label="Y轴值" prop="yAxis">
									<el-select v-model="echartsForm.yAxis" @change="handelEecharts('yAxis',echartsForm.yAxis)">
										<el-option v-for="option in tableHeadeData" :key="option" :label="option.label" :value="option.type" ></el-option>
									</el-select>
								</el-form-item>
							<el-form-item  label="维度"  prop="dimension">
								<el-select v-model="echartsForm.dimension" @change="handelEecharts('dimension',echartsForm.dimension)">
									<el-option label="清空维度" value="resetdimension"></el-option>
									<el-option v-for="option in tableHeadeData" :key="option" :label="option.label" :value="option.type" ></el-option>
								</el-select>
							</el-form-item>
								<el-form-item  label="Y轴最小值" prop="yMin" v-show="echartsForm.type=='line'">
									<el-input-number class="input-number" size="small"  v-model="echartsForm.yMin"   @change="handelYMin(echartsForm.yMin)" @blur="handelYMin(echartsForm.yMin)"></el-input-number>
								</el-form-item>
								<el-form-item  label="Y轴最大值" prop="XMax" v-show="echartsForm.type=='line'">
									<el-input-number class="input-number" size="small"  v-model="echartsForm.XMax"   @change="handelXMax(echartsForm.XMax)" @blur="handelXMax(echartsForm.XMax)"></el-input-number>
								</el-form-item>
						</el-form>
					</div>
					<div class="rowa-footer">
						<el-button type="text" class="reset" @click="resetForm('elForm')">重置</el-button>
<#--						<el-button type="text" class="reset" @click="handel">清空维度</el-button>-->
<#--						<el-button type="text" class="submit" @click="submitForm('elForm')">提交</el-button>-->
					</div>
				</div>
			</div>
			<div  v-show="!expandFlag" class="fshrink" @click="expandBtn">
				<i class="uex-icon-arrow-right"></i>
				<span>筛选</span>

			</div>
		</div>
		<div class="echarts-type-right" :style="{!expandFlag?'95%':'76%'}">
            <#--后期过多可写成循环-->
			<#--折线图-->
			<div class="x-axis-tip"></div>
			<div class="statistics-line" v-show="echartsForm.type=='line'" :key="tabItem.id">
				<div :id="'dataLineGraph'+tabItem.id" style="100%;height:400px" ></div>
			</div>
			<#--柱形图-->
			<div class=" statistics-line statistics-bar" v-show="echartsForm.type=='bar'" :key="tabItem.id">
				<div :id="'dataBarGraph'+tabItem.id" style="100%;height:400px"></div>
			</div>
			<#--折线图-->
			<div class="statistics-line statistics-scatter" v-show="echartsForm.type=='scatter'" :key="tabItem.id">
				<div :id="'dataScatterGraph'+tabItem.id" style="100%;height:400px"></div>
			</div>
		</div>
	</div>
js 我这里通过js 注入进来的组件,可以根据需要注入组件
'use strict';
var dataLineGraph;
var dataBarGraph;
var dataScatterGraph;
Vue.component('echarts-type', {
template:"#echarts-type-template",
props: {
value: String,
visible: {
type: Boolean,
default: false
},
tab:{
type: Object,
default: function() {
return {};
}
},
show: Boolean,
sqlData: {
type: Object,
default: function() {
return {};
}
},
echartsTabelData: {
type: Array,
default: function() {
return [];
}
},
echartsTabelHeader: {
type: Array,
default: function() {
return [];
}
},
rules: {
type: Object,
default: function() {
return {};
}
},
},
data: function() {
return {
currentVisible: this.visible,// 控制是否显示可视化图标
leftWidth:180,
tabItem:this.tab,//tab的信息
expandFlag:true,
isDimension:false,
tableData:this.echartsTabelData,//表格数据
tableHeadeData:this.echartsTabelHeader,//表格头部数据
echartstype:null,
echartsForm: {
type:'',
dimension:'',
xAxis:'',
yAxis:'',
yMin:'',
XMax:'',
},
echartsRules:{
type: [
{ required: true, message: '请选择图形', trigger: 'change' }
],
xAxis: [
{ required: true, message: '请选择X轴值', trigger: 'change' }
],
yAxis: [
{ required: true, message: '请选择Y轴值', trigger: 'change' }
],
},
echartsTypes:[
{
type:'line',
label:'折线图'
},
{
type:'bar',
label:'柱形图'
},
{
type:'scatter',
label:'散点图'
}
],
graphTypeData:{legendData:[],yAxisData:[],xAxisData:[],seriesData:[],min:0, max:2000},
xData:[],
yData:[],
xAxisData:[],
yAxisData:[],
seriesData:[],
type:'value',
};
},
computed: {
},
methods: {
resetForm:function(formName){
var self=this;
this.$refs[formName].resetFields();
dataBarGraph.clear();
this.echartsForm.dimension='';//清空维度
self.graphTypeData.legendData=[];
self.graphTypeData.xAxisData=[];
self.graphTypeData.yAxisData=[];
self.graphTypeData.seriesData=[];
self.graphTypeData.min=0;
self.graphTypeData.max=2000;
},
submitForm:function(){
var self=this;
self.changeEchartsType(self.echartsForm.type);//调用对应的图形
},
expandBtn2:function(){
var self=this;
self.expandFlag = false;
self.leftWidth = 30;
self.$nextTick(function () {
self.resizeGraph();
})
},
expandBtn:function(){
var self=this;
self.expandFlag = true;
self.leftWidth = 180;
self.$nextTick(function () {
self.resizeGraph();
})
},
highLightText:function(){
var self=this;
setTimeout(function(){
var val = self.filterText;
if(val !== null && val !== ''){
var arr = $('.tree-line .el-tree-node .is-focusable .el-tree-node__content span:nth-child(2)');
for(var i=0;i<arr.length;i++){
var values = $(arr[i]).html();
var reg=new RegExp(val,"g"); //创建正则RegExp对象
$(arr[i]).html(values.replace(reg,'<span style="color: red;">' + val + '</span>'));
}
}
},100);
},
filterNode:function(value, data) {
if (!value) return true
return data.label.indexOf(value) !== -1
},
//统计图公共配置
publiconfigureOption:function(graphData,titleText){
var self=this;
var publiconfigure={
title: {
text: titleText,
textStyle:{
fontSize:12,
color: '#202D40',
}
},
color:['#13CE66','#F7BA2A','#FF4949','#8cbbf9','#f07c7c','#20A0FF'],
tooltip: {
trigger: 'axis',
confine: true,
extraCssText: 'white-space: normal; word-break: break-all;z-index:10'
},
toolbox: {
itemSize:12,
right :'20',
top:'-10',
feature: {
saveAsImage: {}
}
},
grid: {
left: '10%',
right: '8%',
bottom: '10%',
containLabel: true
},
dataZoom:self.dataZoomItem(graphData),
yAxis:self.yAxisItem(graphData),
};
return publiconfigure;
},
functionNotDimensionOption:function(graphData,graphDataType){
var self=this;
var isBoundaryGap = graphDataType == 'bar' ? true : false;
var axisLabelInterval = graphDataType == 'bar' ? 0 : 5;
var notDimensionOption = {
xAxis: [
{
type: 'category',
triggerEvent: true,
splitLine: {
show: true, //是否显示网格
lineStyle: {
color: '#dde1e8',
1,
type: 'solid'
}
},
axisLabel : {//坐标颜色
interval:axisLabelInterval,
rotate: 30,
textStyle:{
color:"#606C80"
},
// formatter: function(params) {
// if(params){
// var res=params?params:[];
// if(res.length > 5) {
// res = res.substring(0, 5) + "..";
// }
// return res;
// }else {
// return'';
// }
//
// }
},
axisLine:{//坐标刻度颜色
lineStyle:{
color:'#dde1e8',
}
},
axisTick:{//坐标朝向及颜色
inside: true,
lineStyle:{color:'#dde1e8'}, // x轴刻度的颜色
},
boundaryGap: isBoundaryGap,
data: graphData.xAxisData
}
],
series:self.functionNodname(graphData,graphDataType)//引入方法创建折线
};
return notDimensionOption;
},
functionDimensionOption:function(graphData,graphDataType){
var self=this;
var isBoundaryGap = graphDataType == 'bar' ? true : false;
var axisLabelInterval = graphDataType == 'bar' ? 0 : 5;
var dimensionOption = {
legend: {
type: 'scroll',
pageIconSize: 12, //翻页按钮大小
right:30,
left:30,
top:"5%",//与上方的距离 可百分比% 可像素px
bottom:"5%",//与上方的距离 可百分比% 可像素px
itemWidth: 15,
itemHeight: 10,
itemGap: 10,
textStyle: { //图例文字的样式
color: '#606C80',
fontSize: 12
},
data: graphData.legendData,
},
xAxis: [
{
type: 'category',
splitLine: {
show: true, //是否显示网格
lineStyle: {
color: '#dde1e8',
1,
type: 'solid'
}
},
axisLabel : {//坐标颜色
interval:axisLabelInterval,
rotate: 30,
textStyle: {
color: "#606C80"
},
// formatter: function (params) {
// if(params){
// var res=params?params:[];
// if(res.length > 5) {
// res = res.substring(0, 5) + "..";
// }
// return res;
// }else {
// return'';
// }
// }
},
axisLine:{//坐标刻度颜色
lineStyle:{
color:'#dde1e8',
}
},
axisTick:{//坐标朝向及颜色
inside: true,
lineStyle:{color:'#dde1e8'}, // x轴刻度的颜色
},
boundaryGap:isBoundaryGap,
// data: graphData.xAxisData
}
],
series: self.functionNodname(graphData,graphDataType)//引入方法创建折线
};
return dimensionOption;
},
dataZoomItem:function(graphData){
var self=this;
if(graphData.yAxisData && graphData.yAxisData.length > 20 && self.type == 'category'){
return [
{
type: 'slider',
xAxisIndex: 0,//X轴
start:0,
end:50,
},
{
type: 'slider',
show:true,
yAxisIndex: 0,//Y轴
},
]
}else{
return [
{
type: 'slider',
xAxisIndex: 0,//X轴
start:0,
end:50,
},
{
type: 'slider',
show:false,
yAxisIndex: 0,//Y轴
},
]
}
},
yAxisItem:function(graphData){
var self=this;
if(self.echartsForm.dimension && self.echartsForm.dimension!='resetdimension') {//有维度
if(self.type == 'value'){
return [
{
type: 'value',
splitLine: {
show: true, //是否显示网格
lineStyle: {
color: '#dde1e8',
1,
type: 'solid'
}
},
axisTick:{//坐标朝向及颜色
inside: true,
lineStyle:{color:'#dde1e8'}, // x轴刻度的颜色
},
// data: graphData.yAxisData,
min: graphData.min||0,
max: self.yAxisDataMax(graphData),
axisLine:{
lineStyle:{
color: '#dde1e8',
}
},
axisLabel : {
textStyle:{
color:"#606C80"
},
},
},
]
}else {
return {
type: 'category',
triggerEvent: true,
splitLine: {
show: true, //是否显示网格
lineStyle: {
color: '#dde1e8',
1,
type: 'solid'
}
},
axisLabel : {//坐标颜色
// interval: 5,
rotate: 30,
textStyle:{
color:"#606C80"
},
formatter: function (params) {
if(params){
var res=params?params:[];
if(res.length > 5) {
res = res.substring(0, 5) + "..";
}
return res;
}else {
return'';
}
}
},
axisLine:{//坐标刻度颜色
lineStyle:{
color:'#dde1e8',
}
},
axisTick:{//坐标朝向及颜色
inside: true,
lineStyle:{color:'#dde1e8'}, // x轴刻度的颜色
},
boundaryGap: false,
// data:graphData.yAxisData,
}
}
}else {//没有维度
if(self.type == 'value'){
return [
{
type: 'value',
splitLine: {
show: true, //是否显示网格
lineStyle: {
color: '#dde1e8',
1,
type: 'solid'
}
},
axisTick:{//坐标朝向及颜色
inside: true,
lineStyle:{color:'#dde1e8'}, // x轴刻度的颜色
},
data: graphData.yAxisData,
min: graphData.min||0,
max: self.yAxisDataMax(graphData),
axisLine:{
lineStyle:{
color: '#dde1e8',
}
},
axisLabel : {
textStyle:{
color:"#606C80"
},
},
},
]
}else {
return {
type: 'category',
triggerEvent: true,
splitLine: {
show: true, //是否显示网格
lineStyle: {
color: '#dde1e8',
1,
type: 'solid'
}
},
axisLabel : {//坐标颜色
// interval: 5,
rotate: 30,
textStyle:{
color:"#606C80"
},
formatter: function (params) {
if(params){
var res=params?params:[];
if(res.length > 5) {
res = res.substring(0, 5) + "..";
}
return res;
}else {
return'';
}
}
},
axisLine:{//坐标刻度颜色
lineStyle:{
color:'#dde1e8',
}
},
axisTick:{//坐标朝向及颜色
inside: true,
lineStyle:{color:'#dde1e8'}, // x轴刻度的颜色
},
boundaryGap: false,
data:graphData.yAxisData,
}
}
}
},
yAxisDataMax:function(graphData){
var max=Math.max.apply(null, graphData.yAxisData);
return graphData.max?graphData.max:max!='NaN'?max:2000;
},
drawBarGraphMousemove:function(documentType){
var self=this;
documentType.on('mouseover', function (params) {
if( params.componentType == 'yAxis' ){
var offsetX = params.event.event.offsetX;
var offsetY = params.event.event.offsetY;
var xAxisTip = document.querySelector('.x-axis-tip');
xAxisTip.innerText = params.value.split("#")[0];
xAxisTip.style.left = offsetX +30+ "px";
xAxisTip.style.top = offsetY + 10 + "px";
xAxisTip.style.display = 'block';
}
if (params.componentType == 'xAxis') {
var offsetX = params.event.event.offsetX;
var offsetY = params.event.event.offsetY;
var xAxisTip = document.querySelector('.x-axis-tip');
xAxisTip.innerText = params.value.split("#")[0];
if(!self.expandFlag){
if(offsetX > 300){
xAxisTip.style.left = offsetX-50 + "px";
}else{
xAxisTip.style.left = offsetX + "px";
}
}
if(offsetX > 500){
xAxisTip.style.left = offsetX +60+ "px";
}else{
xAxisTip.style.left = offsetX+ 116 + "px";
}
xAxisTip.style.top = offsetY -65 + "px";
xAxisTip.style.display = 'block';
}
});
documentType.on('mousemove', function (params) {
if( params.componentType == 'yAxis' ){
var offsetX = params.event.event.offsetX;
var offsetY = params.event.event.offsetY;
var xAxisTip = document.querySelector('.x-axis-tip');
xAxisTip.innerText = params.value.split("#")[0];
xAxisTip.style.left = offsetX + 30 + "px";
xAxisTip.style.top = offsetY +10+ "px";
xAxisTip.style.display = 'block';
}
if (params.componentType == 'xAxis') {
var offsetX = params.event.event.offsetX;
var offsetY = params.event.event.offsetY;
var xAxisTip = document.querySelector('.x-axis-tip');
xAxisTip.innerText = params.value.split("#")[0];
if(offsetX > 500){
xAxisTip.style.left = offsetX +60+ "px";
}else{
xAxisTip.style.left = offsetX+ 116 + "px";
}
if(!self.expandFlag){
if(offsetX > 300){
xAxisTip.style.left = offsetX -50 + "px";
}else{
xAxisTip.style.left = offsetX + "px";
}
}
xAxisTip.style.top = offsetY -65 + "px";
xAxisTip.style.display = 'block';
}
});
documentType.on('mouseout', function (params) {
var xAxisTip = document.querySelector('.x-axis-tip');
xAxisTip.style.display = 'none';
});
// dataLineGraph.on('legendScroll',(params) => {
// console.log('params=====',params)
// let index = params.scrollDataIndex;
// let len = this.series.length;
// //后翻页
// if((index + 1)%6 ==0){
// this.scrollDataIndex = index + 1;
// for(let i=0;i<len;i++){
// this.legrendUnSelect[this.series[i].name] = (i > index && i - index <= 6) ? true : false;
// }
// }
// //前翻页
// if((index -1)%6 ==0){
// this.scrollDataIndex = index - 1;
// for(let i=0;i<len;i++){
// this.legrendUnSelect[this.series[i].name] = (i+2 > index && i+2 - index <= 6) ? true : false;
// }
// }
// console.log(this.legrendUnSelect)
// })
},
functionNodname:function(graphData,type){
var self=this;
console.log('self.echartsForm.dimension',self.echartsForm.dimension)
if(!self.echartsForm.dimension || self.echartsForm.dimension == 'resetdimension'){//没有维度
return [
{
color:['#8cbbf9'], //折线条的颜色
type: type,
data: graphData.yAxisData
},
]
}else {
var serie=[];
if(!graphData.legendData){
return ;
}
var seriesDatas=graphData.seriesData;
var Eq=graphData.legendData.length||0;
for(let i=0;i<Eq;i++){
var item={
name:graphData.legendData[i],
type:type,
data:seriesDatas
};
serie.push(item);
}
// //serie提重复
// var tempoplatformList = _.uniq(serie,function(item){
// return item.name;
// });
console.log('serie',serie)
var tempoplatformList=serie;
// 根据name 类目分组
tempoplatformList.forEach(function (item) {
item.data=_.filter(item.data,function (i) {
return i.indexOf(item.name) > -1;
});
});
// serie.forEach(o => o.data = o.data.filter(i => i.includes(o.name)));
//根据name 类目分组下的的item.data数组提重复
// tempoplatformList.forEach(function(item) {
// var keysArr = [];
// item.data=_.filter(item.data, function (itemsub) {
// if (keysArr.includes(itemsub.toString())) {
// return false
// } else {
// keysArr.push(itemsub.toString());
// return true
// }
// });
// });
// console.log('tempoplatformList',tempoplatformList)
return tempoplatformList;
}
},
//折线图
getLineGraphOption:function(graphData){
var self=this;
// var publiconfigure={
// title: {
// text: '折线图',
// textStyle:{
// fontSize:12,
// color: '#202D40',
// }
// },
// color:['#13CE66','#F7BA2A','#FF4949','#8cbbf9','#f07c7c','#20A0FF'],
// tooltip: {
// trigger: 'axis',
// confine: true,
// extraCssText: 'white-space: normal; word-break: break-all;z-index:10'
// },
// toolbox: {
// itemSize:12,
// right :'20',
// top:'-10',
// feature: {
// saveAsImage: {}
// }
// },
// grid: {
// left: '5%',
// right: '8%',
// bottom: '10%',
// containLabel: true
// },
// dataZoom:self.dataZoomItem(graphData),
// yAxis:self.yAxisItem(graphData),
// };
// var notDimensionOption = {
// xAxis: [
// {
// type: 'category',
// triggerEvent: true,
// splitLine: {
// show: true, //是否显示网格
// lineStyle: {
// color: '#dde1e8',
// 1,
// type: 'solid'
// }
// },
// axisLabel : {//坐标颜色
// interval:5,
// // rotate: 70,
// textStyle:{
// color:"#606C80"
// },
// // formatter: function(params) {
// // if(params){
// // var res=params?params:[];
// // if(res.length > 5) {
// // res = res.substring(0, 5) + "..";
// // }
// // return res;
// // }else {
// // return'';
// // }
// //
// // }
// },
// axisLine:{//坐标刻度颜色
// lineStyle:{
// color:'#dde1e8',
// }
// },
// axisTick:{//坐标朝向及颜色
// inside: true,
// lineStyle:{color:'#dde1e8'}, // x轴刻度的颜色
// },
// boundaryGap: false,
// data: graphData.xAxisData
// }
// ],
// series:self.functionNodname(graphData,'line')//引入方法创建折线
// };
// var dimensionOption = {
// legend: {
// type: 'scroll',
// pageIconSize: 12, //翻页按钮大小
// right:30,
// left:30,
// top:"5%",//与上方的距离 可百分比% 可像素px
// bottom:"5%",//与上方的距离 可百分比% 可像素px
// itemWidth: 15,
// itemHeight: 10,
// itemGap: 10,
// textStyle: { //图例文字的样式
// color: '#606C80',
// fontSize: 12
// },
// data: graphData.legendData,
// },
// xAxis: [
// {
// type: 'category',
// splitLine: {
// show: true, //是否显示网格
// lineStyle: {
// color: '#dde1e8',
// 1,
// type: 'solid'
// }
// },
// axisLabel : {//坐标颜色
// interval:5,
// // rotate: 30,
// textStyle: {
// color: "#606C80"
// },
// // formatter: function (params) {
// // if(params){
// // var res=params?params:[];
// // if(res.length > 5) {
// // res = res.substring(0, 5) + "..";
// // }
// // return res;
// // }else {
// // return'';
// // }
// // }
// },
// axisLine:{//坐标刻度颜色
// lineStyle:{
// color:'#dde1e8',
// }
// },
// axisTick:{//坐标朝向及颜色
// inside: true,
// lineStyle:{color:'#dde1e8'}, // x轴刻度的颜色
// },
// boundaryGap: false,
// // data: graphData.xAxisData
// }
// ],
// series: self.functionNodname(graphData,'line')//引入方法创建折线
// };
var publiconfigure=self.publiconfigureOption(graphData,'折线图');
var notDimensionOption=self.functionNotDimensionOption(graphData,'line');
var dimensionOption=self.functionDimensionOption(graphData,'line');
if(self.echartsForm.dimension && self.echartsForm.dimension!='resetdimension'){//有维度
console.log('option--有维度',_.extend({},publiconfigure,dimensionOption))
return _.extend({},publiconfigure,dimensionOption);
}else{
console.log('option',_.extend({},publiconfigure,notDimensionOption))
return _.extend({},publiconfigure,notDimensionOption);
}
},
drawLineGraph: function () {
var self = this;
self.$nextTick(function () {
dataLineGraph = echarts.init(document.getElementById('dataLineGraph'+self.tabItem.id));
dataLineGraph.clear();
dataLineGraph.setOption(this.getLineGraphOption(self.graphTypeData,true));
self.drawBarGraphMousemove(dataLineGraph);
window.onresize = function () {
if (dataLineGraph) {
dataLineGraph.resize();
}
}
})
},
//柱形图
getBarGraphOption:function(graphData){
var self=this;
console.log('graphData',graphData)
// var publiconfigure={
// title: {
// text: '柱形图',
// textStyle:{
// fontSize:12,
// color: '#202D40',
// }
// },
// color:['#13CE66','#F7BA2A','#FF4949','#8cbbf9','#f07c7c','#20A0FF'],
// tooltip: {
// trigger: 'axis',
// confine: true,
// extraCssText: 'white-space: normal; word-break: break-all;z-index:10'
// },
// toolbox: {
// itemSize:12,
// right :'20',
// top:'-10',
// feature: {
// saveAsImage: {}
// }
// },
// grid: {
// left: '5%',
// right: '8%',
// bottom: '10%',
// containLabel: true
// },
// dataZoom:self.dataZoomItem(graphData),
// yAxis:self.yAxisItem(graphData),
// };
// var notDimensionBarOption = {
// xAxis: [
// {
// type: 'category',
// triggerEvent: true,
// splitLine: {
// show: true, //是否显示网格
// lineStyle: {
// color: '#dde1e8',
// 1,
// type: 'solid'
// }
// },
// axisLabel : {//坐标颜色
// interval:5,
// // rotate: 30,
// textStyle:{
// color:"#606C80"
// },
// // formatter: function(params) {
// // if(params){
// // var res=params?params:[];
// // if(res.length > 5) {
// // res = res.substring(0, 5) + "..";
// // }
// // return res;
// // }else {
// // return'';
// // }
// // }
// },
// axisLine:{//坐标刻度颜色
// lineStyle:{
// color:'#dde1e8',
// }
// },
// axisTick:{//坐标朝向及颜色
// inside: true,
// lineStyle:{color:'#dde1e8'}, // x轴刻度的颜色
// },
// boundaryGap: true,
// data: graphData.xAxisData
// }
// ],
// series:self.functionNodname(graphData,'bar')//引入方法创建折线
// };
// var dimensionOption = {
// legend: {
// type: 'scroll',
// pageIconSize: 12, //翻页按钮大小
// right:30,
// left:30,
// top:"5%",//与上方的距离 可百分比% 可像素px
// bottom:"5%",//与上方的距离 可百分比% 可像素px
// itemWidth: 15,
// itemHeight: 10,
// itemGap: 10,
// textStyle: { //图例文字的样式
// color: '#606C80',
// fontSize: 12
// },
// data: graphData.legendData,
// },
// xAxis: [
// {
// type: 'category',
// splitLine: {
// show: true, //是否显示网格
// lineStyle: {
// color: '#dde1e8',
// 1,
// type: 'solid'
// }
// },
// axisLabel : {//坐标颜色
// interval:5,
// // rotate: 30,
// textStyle:{
// color:"#606C80"
// },
// // formatter: function(params) {
// // if(params){
// // var res=params?params:[];
// // if(res.length > 5) {
// // res = res.substring(0, 5) + "..";
// // }
// // return res;
// // }else {
// // return'';
// // }
// // }
// },
// axisLine:{//坐标刻度颜色
// lineStyle:{
// color:'#dde1e8',
// }
// },
// axisTick:{//坐标朝向及颜色
// inside: true,
// lineStyle:{color:'#dde1e8'}, // x轴刻度的颜色
// },
// boundaryGap: true,
// }
// ],
// series: self.functionNodname(graphData,'bar')//引入方法创建折线
// };
var publiconfigure=self.publiconfigureOption(graphData,'柱形图');
var notDimensionBarOption=self.functionNotDimensionOption(graphData,'bar');
var dimensionOption=self.functionDimensionOption(graphData,'bar');
console.log('self.isDimension',self.echartsForm.dimension)
if(self.echartsForm.dimension && self.echartsForm.dimension!='resetdimension'){//有维度
console.log('有维度',_.extend({},publiconfigure,dimensionOption))
return _.extend({},publiconfigure,dimensionOption);
}else{
console.log('--没有维度',_.extend({},publiconfigure,notDimensionBarOption))
return _.extend({},publiconfigure,notDimensionBarOption);
}
},
drawBarGraph: function () {
var self = this;
self.$nextTick(function () {
dataBarGraph = echarts.init(document.getElementById('dataBarGraph' + self.tabItem.id));
dataBarGraph.clear();
dataBarGraph.setOption(this.getBarGraphOption(self.graphTypeData), true);
self.drawBarGraphMousemove(dataBarGraph);
window.onresize = function () {
if (dataBarGraph) {
dataBarGraph.resize()
}
}
})
},
//散点图
getScatterGraphOption:function(graphData){
var self=this;
// var publiconfigure={
// title: {
// text: '散点图',
// textStyle:{
// fontSize:12,
// color: '#202D40',
// }
// },
// color:['#13CE66','#F7BA2A','#FF4949','#8cbbf9','#f07c7c','#20A0FF'],
// tooltip: {
// trigger: 'axis',
// },
// toolbox: {
// itemSize:12,
// right :'20',
// top:'-10',
// feature: {
// saveAsImage: {}
// }
// },
// grid: {
// left: '5%',
// right: '4%',
// bottom: '10%',
// containLabel: true
// },
// dataZoom: [
// {
// type: 'slider',
// startValue: 0,
// endValue:20
// },
// {
// type: 'inside'
// },
// ],
// yAxis:self.yAxisItem(graphData),
// };
// var notDimensionBarOption = {
// xAxis: [
// {
// type: 'category',
// triggerEvent: true,
// splitLine: {
// show: true, //是否显示网格
// lineStyle: {
// color: '#dde1e8',
// 1,
// type: 'solid'
// }
// },
// axisLabel : {//坐标颜色
// interval:5,
// // rotate: 30,
// textStyle:{
// color:"#606C80"
// },
// // formatter: function(params) {
// // if(params){
// // var res=params?params:[];
// // if(res.length > 5) {
// // res = res.substring(0, 5) + "..";
// // }
// // return res;
// // }else {
// // return'';
// // }
// // }
// },
// axisLine:{//坐标刻度颜色
// lineStyle:{
// color:'#dde1e8',
// }
// },
// axisTick:{//坐标朝向及颜色
// inside: true,
// lineStyle:{color:'#dde1e8'}, // x轴刻度的颜色
// },
// boundaryGap: true,
// data: graphData.xAxisData
// }
// ],
// series: [{
// name: graphData.indexName,
// data:graphData.yAxisData,
// type: 'scatter',
// showBackground: true,
// backgroundStyle: {
// color: 'rgba(220, 220, 220, 0.8)'
// }
// }]
// };
// var dimensionOption = {
// legend: {
// type: 'scroll',
// pageIconSize: 12, //翻页按钮大小
// right:30,
// left:30,
// top:"5%",//与上方的距离 可百分比% 可像素px
// bottom:"5%",//与上方的距离 可百分比% 可像素px
// itemWidth: 15,
// itemHeight: 10,
// itemGap: 10,
// textStyle: { //图例文字的样式
// color: '#606C80',
// fontSize: 12
// },
// data: graphData.legendData,
// },
// xAxis: [
// {
// type: 'category',
// triggerEvent: true,
// splitLine: {
// show: true, //是否显示网格
// lineStyle: {
// color: '#dde1e8',
// 1,
// type: 'solid'
// }
// },
// axisLabel : {//坐标颜色
// interval:5,
// // rotate: 30,
// textStyle:{
// color:"#606C80"
// },
// // formatter: function(params) {
// // if(params){
// // var res=params?params:[];
// // if(res.length > 5) {
// // res = res.substring(0, 5) + "..";
// // }
// // return res;
// // }else {
// // return'';
// // }
// // }
// },
// axisLine:{//坐标刻度颜色
// lineStyle:{
// color:'#dde1e8',
// }
// },
// axisTick:{//坐标朝向及颜色
// inside: true,
// lineStyle:{color:'#dde1e8'}, // x轴刻度的颜色
// },
// boundaryGap: true,
// }
// ],
// series: self.functionNodname(graphData,'scatter')//引入方法创建折线
// };
var publiconfigure=self.publiconfigureOption(graphData,'散点图');
var notDimensionScatterOption=self.functionNotDimensionOption(graphData,'scatter');
var dimensionOption=self.functionDimensionOption(graphData,'scatter');
if(self.echartsForm.dimension && self.echartsForm.dimension!='resetdimension'){//有维度
return _.extend({},publiconfigure,dimensionOption);
}else{
return _.extend({},publiconfigure,notDimensionScatterOption);
}
},
drawScatterGraph: function () {
var self = this;
self.$nextTick(function () {
dataScatterGraph = echarts.init(document.getElementById('dataScatterGraph' + self.tabItem.id));
dataScatterGraph.clear();
dataScatterGraph.setOption(self.getScatterGraphOption(self.graphTypeData), true);
self.drawBarGraphMousemove(dataScatterGraph);
window.onresize = function () {
if (dataScatterGraph) {
dataScatterGraph.resize()
}
}
})
},
//配置改变
handelEechartsType:function(type,val){
var self=this;
self.graphTypeData.legendData=[];
self.graphTypeData.yAxisData=[];
self.graphTypeData.xAxisData=[];
self.graphTypeData.seriesData=[];
self.graphTypeData.min=0;
self.graphTypeData.max=parseInt((Math.max(...self.graphTypeData.yAxisData) + 2000) / 1000) * 1000;
self.changeEchartsType(val);
self.$nextTick( function () {
self.$refs['elForm'].resetFields();
self.echartsForm.type=val;
})
},
//统一改变
handelEecharts:function(type,val){
var self=this;
switch (type) {
case 'type'://选择图形
self.changeEchartsType(val);
break;
case 'xAxis'://X轴值
self.changeXAxis(val);
break;
case 'yAxis'://Y轴值
self.changeYAxis(val);
break;
case 'dimension'://维度
console.log('val',val)
self.changeDimension(val);
break;
default :
break
}
self.$nextTick(function () {
self.resizeGraph();
})
},
//维度
changeDimension:function(val){
//根据值去获取对应的数据eg:val-姓名 获取表格的全部姓名的值作为这些的类型数据
//元数据
var self=this;
self.isDimension=true;// 有维度
self.seriesData=[];
var graphData = {},legendData=[],seriesData;
let itemVal="";
this.tableData.forEach(function (item) {
legendData.push(item[val]);
itemVal=item[val];//王小虎1根据类型进行组装seriesData数据
self.seriesData.push([item[self.echartsForm.xAxis],item[self.echartsForm.yAxis],item[val]]);
});
//serie提重复
var legendDataUniq = _.uniq(legendData,function(item){
return item;
});
legendData = _.uniq(legendData,function(item){
return item;
});
graphData = {
legendData:legendDataUniq,
seriesData:self.seriesData
};
console.log('graphData--维度',graphData)
self.graphTypeData=_.extend(self.graphTypeData,graphData);
self.changeEchartsType(self.echartsForm.type);//调用对应的图形
},
//X轴值
changeXAxis:function(val){
var self=this;
self.isDimension=false;// 有维度
var graphData = {};
self.xAxisData=[];
self.seriesData=[];
this.tableData.forEach(function (item) {
if(self.echartsForm.xAxis||self.echartsForm.yAxis){
self.xAxisData.push(item[self.echartsForm.xAxis]);
self.seriesData.push([item[self.echartsForm.xAxis],item[self.echartsForm.yAxis],item[val],item[self.echartsForm.dimension]]);
}else {
self.xAxisData=[];
self.seriesData=[];
}
});
graphData = {
xAxisData:self.xAxisData,
seriesData:self.seriesData
};
console.log('graphData',graphData)
self.graphTypeData=_.extend(self.graphTypeData,graphData);
self.changeEchartsType(self.echartsForm.type);//调用对应的图形
},
//Y轴值
changeYAxis:function(val){
var self=this;
self.isDimension=false;// 有维度
//有维度
var graphData = {};
self.yAxisData=[];
self.seriesData=[];
this.tableData.forEach(function (item) {
if(self.echartsForm.xAxis||self.echartsForm.yAxis){
var itemY=item[self.echartsForm.yAxis];
self.yAxisData.push(itemY == null?0:itemY);
self.seriesData.push([item[self.echartsForm.xAxis],item[self.echartsForm.yAxis],item[val],item[self.echartsForm.dimension]]);
}else{
self.yAxisData=[];
self.seriesData=[];
}
});
graphData = {
yAxisData:self.yAxisData,
seriesData:self.seriesData
};
var type='value';
self.yAxisData.forEach(function (item) {
console.log('typeof',typeof parseInt(item))
var reg = new RegExp("^[0-9]*$");
if(reg.test(item)){
type='value';
}else{
type='category';
}
});
self.type=type;//根据类型判断显示数值还是类目
let max = Math.max.apply(null, self.yAxisData);
self.echartsForm.XMax=max!='NaN'?max:2000;
self.graphTypeData=_.extend(self.graphTypeData,graphData);
self.changeEchartsType(self.echartsForm.type);//调用对应的图形
},
//最小值
handelYMin:function(val){
var self=this;
},
//最大值
handelXMax:function(val){
},
//选择图形
changeEchartsType:function(val){
var self=this;
// self.graphTypeData.legendData=[];
// self.graphTypeData.xAxisData=[];
// self.graphTypeData.yAxisData=[];
// self.graphTypeData.seriesData=[];
// self.graphTypeData.min=0;
// self.graphTypeData.max=2000;
switch (val) {
case 'line'://折线图
self.$nextTick(function () {
self.drawLineGraph();
});
break;
case 'bar'://柱形图
self.$nextTick(function () {
self.drawBarGraph();
});
break;
case 'scatter'://散点图
self.$nextTick(function () {
self.drawScatterGraph();
});
break;
default :
break
}
console.log('changeEchartsType-self.graphTypeData',self.graphTypeData)
self.$nextTick(function () {
self.resizeGraph();
})
},
handel:function(){
this.echartsForm.dimension='';
},
resizeGraph: function() {
var self=this;
self.$nextTick(function () {
if (dataLineGraph) {
dataLineGraph.resize();
}
if(dataBarGraph){
dataBarGraph.resize();
}
if(dataScatterGraph){
dataScatterGraph.resize();
}
});
},
filterTabelHeade:function (type) {
var self=this;
var tableHeade=_.map(self.tableData3,function (item,index) {
return item[type];
});
return tableHeade;
}
},
watch: {
echartsTabelData(val){
this.tableData = val;
var self=this;
self.$nextTick( function () {
self.$refs['elForm'].resetFields();
self.echartsForm.type=val;
})
},
echartsTabelHeader(val){
this.tableHeadeData = val;
var self=this;
self.$nextTick( function () {
self.$refs['elForm'].resetFields();
self.echartsForm.type=val;
})
},
tab:{
immediate: true,
handler (newVal) {
this.tabItem=newVal;
},
deep: true,
},
filterText(val) {
var arr = $('.tree-line .el-tree-node .is-focusable .el-tree-node__content span:nth-child(2)');
for(var i=0;i<arr.length;i++){
var values = $(arr[i]).html();
$(arr[i]).html(values.split('<span style="color: red;">').join("").split('</span>').join(""));
$(arr[i]).html(values);
}
this.$refs.refTree.filter(val);
},
value: function(val) {
this.form.sql = val;
},
'form.sql': function(val) {
this.$emit('input', val);
},
'echartsForm.yMin':function(val){
var self=this;
self.graphTypeData.min=val;
self.changeEchartsType(self.echartsForm.type);//调用对应的图形
},
'echartsForm.XMax':function(val){
var self=this;
self.graphTypeData.max=val;
self.changeEchartsType(self.echartsForm.type);//调用对应的图形
},
visible: function(val) {
var self = this;
self.changeEchartsType(self.echartsForm.type);//调用对应的图形
// if (val) {
// self.getHistory();
// }
this.currentVisible = val;
},
},
created: function() {
},
mounted: function() {
this.filterTabelHeade('name');
this.changeEchartsType(this.echartsForm.type);//调用对应的图形
if (window.addEventListener) {
window.addEventListener('resize', this.resizeGraph);
} else if (window.attachEvent) {
window.attachEvent('onresize', this.resizeGraph);
}
},
destroyed: function() {
}
});
css
.echarts-type {
    height: 100%;
     800px;
    overflow: auto;
    position: absolute;
    top: 30px;
    bottom: 1px;
    right: 42px;
    z-index: 2000;
    -webkit-transition: all .1s;
    -ms-transition: all .1s;
    -moz-transition: all .1s;
    -o-transition: all .1s;
    transition: all .1s;

}
.echarts-type.visible{
    opacity: 1;
    left: calc(100% - 824px);
    box-shadow: 0 0px 5px 0 #d3d3d3;
}
.echarts-type.hidden{
    opacity: 0;
    left: 100%;
}

.echarts-type-top{
    display: flex;
    justify-content: space-between;
}
.echarts-type .echarts-type-left {
    float: left;
     180px;
    background: #F5F7FA;
    height: 100%;
    overflow-x: hidden;
    overflow-y: auto;

}
.echarts-expand{
    height: 100%;

}

.echarts-expand .rowa-title {
    display: flex;
    justify-content: space-between;
    padding: 10px;
}
.echarts-expand .fexpand .rowa-content{
    padding: 10px;
}
.echarts-expand .fexpand .rowa-footer{
    height: 40px;
    border-top: 1px solid #AAB0BD ;
    text-align: center;
    line-height: 40px;
}
.echarts-type-left .fshrink {
    display: flex;
    flex-direction: column;
    justify-content: flex-start;
    align-items: center;
    cursor: pointer;
    padding-top: 20px;
}
.echarts-type-left .fshrink i{
    margin-bottom: 20px;
}
.echarts-type-left .fshrink span{
     14px;
}
.echarts-expand .fexpand .rowa-footer .reset {
    color: #606C80 ;
}
.input-number .el-input-number--small {
     160px;
}
.el-input-number--small{
     160px;
}
.el-input-number--small .el-input-number__decrease {
    line-height: 24px;
}
.el-input-number--small .el-input-number__decrease{
    right: 26px;
}
.el-input-number--small .el-input-number__increase{
    line-height: 24px !important;
     30px !important;
}
.el-input--small .el-input__inner{
    height: 24px;
}


.echarts-type .echarts-type-right {
     76%;
    float: left;
    padding-top: 10px;
    background: white;
}
.echarts-form .el-select>.el-input {
    display: inline-block !important;
}

.echarts-type .el-form .el-form-item {
    margin-bottom: 5px;
}
.echarts-type.el-form-item.is-error .elx-codemirror {
border: 1px solid #ff4949;
}
.echarts-type .el-form-item.is-error .el-form-item__error {
bottom: 0px;
top: auto;
z-index: 2000;
background: #ff4849;
color: #fff;
line-height: 24px;
padding-top: 0px;
padding: 0px 10px;
}


.elx-codemirror-search-content{
padding-top: 12px
}


.elx-codemirror {
overflow: hidden;
}
.elx-codemirror.search .elx-codemirror-search-content.search {
padding: 7px;
}
.elx-codemirror.search .elx-codemirror-content {
height: calc(100% - 30px) !important;
}
.elx-codemirror.replace .elx-codemirror-search-content.replace {
padding: 7px;
}
.elx-codemirror.replace .elx-codemirror-content {
height: calc(100% - 55px) !important;
}
.elx-codemirror-search-content .button-group button.el-button {
height: 22px;
}
.elx-codemirror-search-content .button-group button.el-button>span {
transform: scale(1);
-webkit-transform: scale(1);
-ms-transform: scale(1);
-o-transform: scale(1);
-moz-transform: scale(1);
}
.elx-codemirror .CodeMirror-code pre.CodeMirror-line {
font-family: "Helvetica Neue",Helvetica,"PingFang SC","Hiragino Sans GB","Microsoft YaHei","微软雅黑",Arial,sans-serif
}
.data-dict-list {
position: fixed !important;
top: 50px !important;
left: 50px !important;
 calc(100% - 100px) !important;
height: calc(100% - 100px) !important;
min-height: 40px;
box-shadow: 0px 0px 100px #1C1C1C;
background: #fff;
z-index: 3000;
}
.data-dict-close {
position: absolute;
top: -8px;
right: -8px;
z-index: 3000;
background: #eaeaea;
font-size: 16px;
border-radius: 50%;
 16px;
height: 16px;
color: #475669;
line-height: 14px;
box-shadow: 0px 0px 5px #475669;
cursor: pointer;
}
.line-legend{
    padding: 0;
     50%;
    margin-left: 25%;
    text-align: center;
}
.line-legend li{
     50%;
    display: inline-block;
}
.line-legend span{
     38%;
    height: 3px;
    display: inline-block;
    vertical-align: middle;
    margin-right: 20px;
}
.x-axis-tip{
    z-index: 1;
    display: none;
    position: absolute;
    padding: 5px 5px;
    font-size: 12px;
    line-height: 18px;
    color: #FFFFFF;
    background: #6d7683;
    box-shadow: 0 1px 4px 0 rgba(0,0,0,0.20);
    border-radius: 4px;
}
调用
      tabItem是一对象,主要是为了取不同的ID,tabItem:{id:'dfdf'}
      showEcharts:false,
      echartsTabelHeader:['测试1,‘测试2’',],
      echartsTabelData:tableData: [{
          date: '2016-05-02',
          name: '王小虎',
          address: '上海市普陀区金沙江路 1518 弄'
        }, {
          date: '2016-05-04',
          name: '王小虎',
          address: '上海市普陀区金沙江路 1517 弄'
        }, {
          date: '2016-05-01',
          name: '王小虎',
          address: '上海市普陀区金沙江路 1519 弄'
        }, {
          date: '2016-05-03',
          name: '王小虎',
          address: '上海市普陀区金沙江路 1516 弄'
        }]
   <echarts-type
                    ref="echarts"
                    :tab="tabItem"
                    :visible="showEcharts"
                    :echarts-tabel-data="echartsTabelData"
                    :echarts-tabel-header="echartsTabelHeader">
            </echarts-type>
朋友的公众号有时候也会分享干货,公众号名字‘web前端面试宝典’,我这里没有涉及到的可以上去看看