JFreeChart是JAVA平台上的一个开放的图表绘制类库。它完全使用JAVA语言编写,是为applications, applets, servlets 以及JSP等使用所设计。下面我就详细介绍如何使用jfreechart生成柱状图、折线图、和饼状图。
步骤:
①、导入其相应的jcommon-1.0.16.jar和jfreechart-1.0.13.jar文件,下载路径:https://github.com/wangbijian/Jar.git
②、下面就可以写实现各种图形的代码了
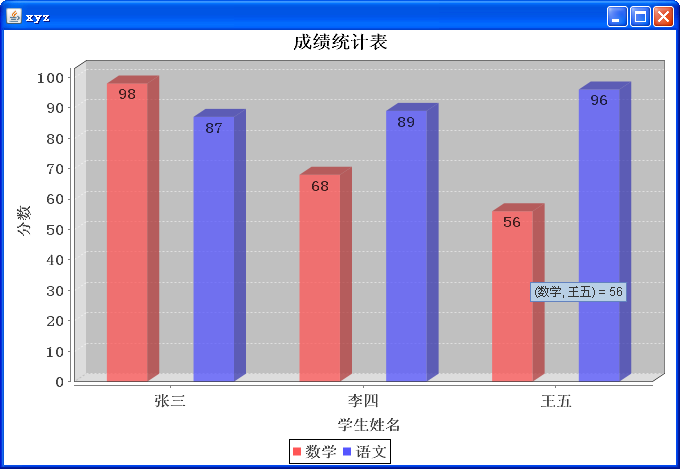
A、生成柱状图:
package com.test.jfreeChart;

import java.awt.Font;
import java.io.File;
import java.io.IOException;

import org.jfree.chart.ChartFactory;
import org.jfree.chart.ChartFrame;
import org.jfree.chart.ChartUtilities;
import org.jfree.chart.JFreeChart;
import org.jfree.chart.axis.CategoryAxis3D;
import org.jfree.chart.axis.NumberAxis3D;
import org.jfree.chart.axis.NumberTickUnit;
import org.jfree.chart.labels.StandardCategoryItemLabelGenerator;
import org.jfree.chart.plot.CategoryPlot;
import org.jfree.chart.plot.PlotOrientation;
import org.jfree.chart.renderer.category.BarRenderer3D;
import org.jfree.data.category.DefaultCategoryDataset;

public class jfreeChart {
    public static void main(String[] args) {
        // TODO Auto-generated method stub
        DefaultCategoryDataset dataset=new DefaultCategoryDataset();
        //添加数据
        dataset.addValue(98, "数学", "张三");
        dataset.addValue(87, "语文", "张三");
        dataset.addValue(68, "数学", "李四");
        dataset.addValue(89, "语文", "李四");
        dataset.addValue(56, "数学", "王五");
        dataset.addValue(96, "语文", "王五");

        JFreeChart chart=ChartFactory.createBarChart3D(
                "成绩统计表",
                "学生姓名",//X轴的标签
                "分数",//Y轴的标签
                dataset, //图标显示的数据集合
                PlotOrientation.VERTICAL, //图像的显示形式(水平或者垂直)
                true,//是否显示子标题
                true,//是否生成提示的标签
                true); //是否生成URL链接
               //处理图形上的乱码
                //处理主标题的乱码
                chart.getTitle().setFont(new Font("宋体",Font.BOLD,18));
                //处理子标题乱码
                chart.getLegend().setItemFont(new Font("宋体",Font.BOLD,15));
                //获取图表区域对象
                CategoryPlot categoryPlot = (CategoryPlot)chart.getPlot();
                //获取X轴的对象
                CategoryAxis3D categoryAxis3D = (CategoryAxis3D)categoryPlot.getDomainAxis();
                //获取Y轴的对象
                NumberAxis3D numberAxis3D = (NumberAxis3D)categoryPlot.getRangeAxis();
                //处理X轴上的乱码
                categoryAxis3D.setTickLabelFont(new Font("宋体",Font.BOLD,15));
                //处理X轴外的乱码
                categoryAxis3D.setLabelFont(new Font("宋体",Font.BOLD,15));
                //处理Y轴上的乱码
                numberAxis3D.setTickLabelFont(new Font("宋体",Font.BOLD,15));
                //处理Y轴外的乱码
                numberAxis3D.setLabelFont(new Font("宋体",Font.BOLD,15));
                //处理Y轴上显示的刻度,以10作为1格
                numberAxis3D.setAutoTickUnitSelection(false);
                NumberTickUnit unit = new NumberTickUnit(10);
                numberAxis3D.setTickUnit(unit);
                //获取绘图区域对象
                BarRenderer3D barRenderer3D = (BarRenderer3D)categoryPlot.getRenderer();
                //设置柱形图的宽度
                barRenderer3D.setMaximumBarWidth(0.07);
                //在图形上显示数字
                barRenderer3D.setBaseItemLabelGenerator(new StandardCategoryItemLabelGenerator());
                barRenderer3D.setBaseItemLabelsVisible(true);
                barRenderer3D.setBaseItemLabelFont(new Font("宋体",Font.BOLD,15));

                //在D盘目录下生成图片
                File file = new File("D:/chart.jpeg");
                try {
                    ChartUtilities.saveChartAsJPEG(file, chart, 800, 600);
                } catch (IOException e) {
                    e.printStackTrace();
                }

                //使用ChartFrame对象显示图像
                ChartFrame frame = new ChartFrame("xyz",chart);
                frame.setVisible(true);
                frame.pack();
    }

}
结果:
B、生成饼图:
package com.test.jfreeChart;

import java.awt.Font;
import java.io.File;
import java.io.IOException;

import org.jfree.chart.ChartFactory;
import org.jfree.chart.ChartFrame;
import org.jfree.chart.ChartUtilities;
import org.jfree.chart.JFreeChart;
import org.jfree.chart.labels.StandardPieSectionLabelGenerator;
import org.jfree.chart.plot.PiePlot3D;
import org.jfree.data.general.DefaultPieDataset;

public class jfreeChart2 {
    public static void main(String[] args) {
        // TODO Auto-generated method stub
        DefaultPieDataset dataset = new DefaultPieDataset();
        //添加数据
        dataset.setValue("张三",40);
        dataset.setValue("李四",32);
        dataset.setValue("王五",28);
        JFreeChart chart = ChartFactory.createPieChart3D("比重统计报表(所属单位)", //主标题的名称
                                      dataset, //图标显示的数据集合
                                      true,//是否显示子标题
                                      true,//是否生成提示的标签
                                      true); //是否生成URL链接
        //处理图形上的乱码
        //处理主标题的乱码
        chart.getTitle().setFont(new Font("宋体",Font.BOLD,18));
        //处理子标题乱码
        chart.getLegend().setItemFont(new Font("宋体",Font.BOLD,15));
        //获取图表区域对象
        PiePlot3D categoryPlot = (PiePlot3D)chart.getPlot();
        //处理图像上的乱码
        categoryPlot.setLabelFont(new Font("宋体",Font.BOLD,15));
        //设置图形的生成格式为(上海 2 (10%))
        String format = "{0} {1} ({2})";
        categoryPlot.setLabelGenerator(new StandardPieSectionLabelGenerator(format));

        //在D盘目录下生成图片
        File file = new File("chart2.jpg");
        try {
            ChartUtilities.saveChartAsJPEG(file, chart, 800, 600);
        } catch (IOException e) {
            e.printStackTrace();
        }
        //使用ChartFrame对象显示图像
        ChartFrame frame = new ChartFrame("xyz",chart);
        frame.setVisible(true);
        frame.pack();
    }
}
结果:
