python风控建模实战lendingClub(博主录制,包含大量回归建模脚本,2K超清分辨率)
https://study.163.com/course/courseMain.htm?courseId=1005988013&share=2&shareId=400000000398149

微信扫二维码,免费学习更多python资源

在一个回归方程中,假如两个或两个以上解释变量彼此高度相关,那么回归分析的结果将有可能无法分清每一个变量与因变量之间的真实关系。例如我们要知道吸毒对SAT考试分数的影响,我们会询问对象是否吸收过可卡因或海洛因,并用软件计算它们之间的系数。
虽然求出了海洛因和可卡因额回归系数,但两者相关性发生重叠,使R平方变大,依然无法揭开真实的情况。
因为吸食海洛因的人常常吸食可卡因,单独吸食一种毒品人很少。
当两个变量高度相关时,我们通常在回归方程中只采用其中一个,或创造一个新的综合变量,如吸食可卡因或海洛因。
又例如当研究员想要控制学生的整体经济背景时,他们会将父母双方的受教育程度都纳入方程式中。
如果单独把父亲或母亲的教育程度分离考虑,会引起混淆,分析变得模糊,因为丈夫和妻子的教育程度有很大相关性。
多元共线性带来问题:
(1)自变量不显著
(2)参数估计值的正负号产生影响
共线性统计量:
(1)容忍度tolerance
tolerance<0.1 表示存在严重多重共线
(2)方差扩大因子 variance inflation factor (VIF)
VIF>10表示存在严重多重共线性
http://blog.csdn.net/baimafujinji/article/details/49799409
回归分析是数据挖掘中最基本的方法,其中基于普通最小二乘法的多元线性回归要求模型中的特征数据不能存在有多重共线性,否则模型的可信度将大打折扣。但是就是技术而言,如何确定模型中的各各特征之间是否有多重共线性呢?
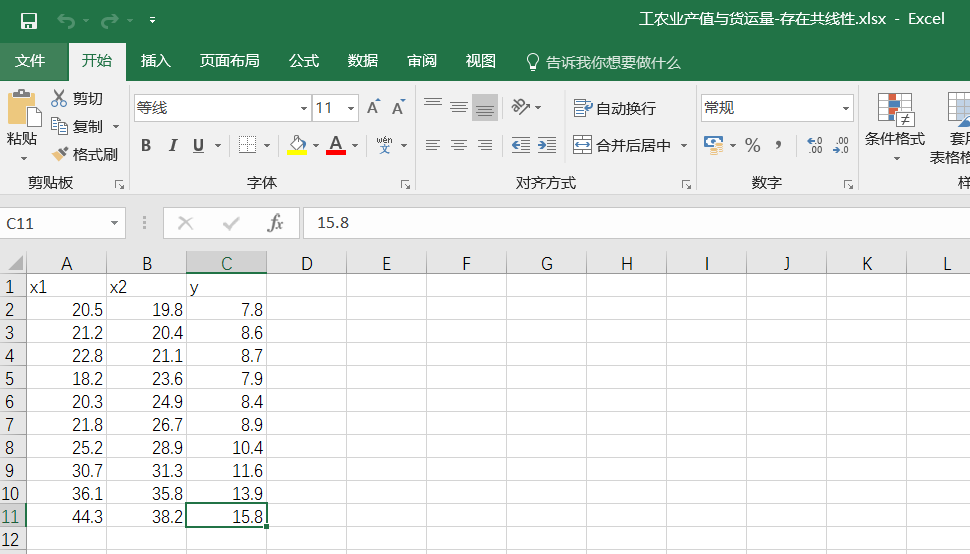
先来看一组数据


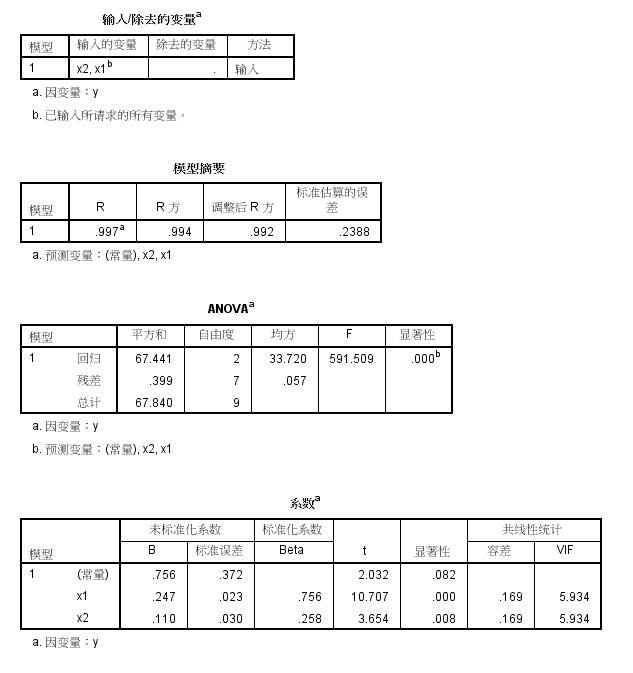
然后单击菜单栏上的【分析】->【回归】->【线性...】,则进入如下图所示的线性回归对话框。当选择好因变量和自变量之后,选择右上角的【Statistics...】,然后在弹出的新对话框里选定【共线性诊断】

红色框所标出的条件指数高达23.973(>10),可见共线性是确凿无疑的了!

python代码
# -*- coding: utf-8 -*-
"""
Created on Thu Feb 22 17:12:03 2018
@author: Administrator
"""
import pandas as pd
from statsmodels.formula.api import ols
df=pd.read_excel("工农业产值与货运量-存在共线性.xlsx")
#多元回归函数
def MulitiLinear_regressionModel(df):
'''Multilinear regression model, calculating fit, P-values, confidence intervals etc.'''
# --- >>> START stats <<< ---
# Fit the model
model = ols("y ~ x1 + x2", df).fit()
# Print the summary
print((model.summary()))
# --- >>> STOP stats <<< ---
return model._results.params # should be array([-4.99754526, 3.00250049, -0.50514907])
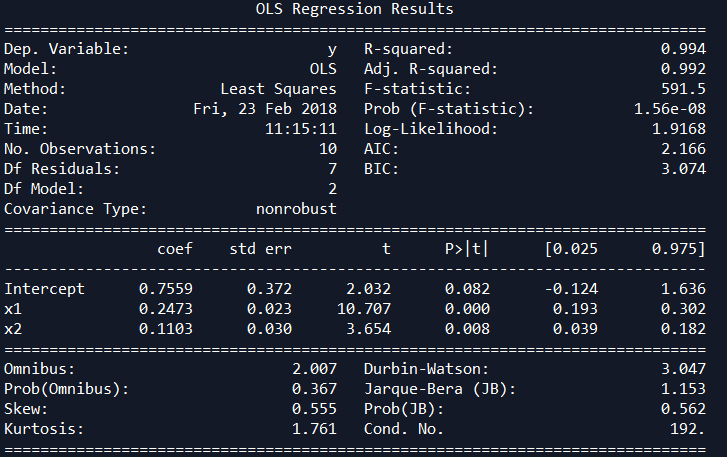
MulitiLinear_regressionModel(df)
condition num=192
R **2 为0.992,和spss的结果一致
x1和x2, x1和y,x2和y的相关系数对比
# -*- coding: utf-8 -*-
"""
Created on Thu Feb 22 11:35:50 2018

@author: Administrator
"""
import pandas as pd
import scipy.stats as stats


df=pd.read_excel("工农业产值与货运量-存在共线性.xlsx")
array_values=df.values
x1=[i[0] for i in array_values]
x2=[i[1] for i in array_values]
y=[i[2] for i in array_values]
sample=len(x1)


print("use Pearson,parametric tests x1 and x2")
r,p=stats.pearsonr(x1,x2)
print("pearson r**2:",r**2)
print("pearson p:",p)
if sample<30:
    print("when sample <30,pearson has no mean")
print("-"*100)

print("use Pearson,parametric tests x1 and y")
r,p=stats.pearsonr(x1,y)
print("pearson r**2:",r**2)
print("pearson p:",p)
if sample<30:
    print("when sample <30,pearson has no mean")
print("-"*100)


print("use Pearson,parametric tests x2 and y")
r,p=stats.pearsonr(x2,y)
print("pearson r**2:",r**2)
print("pearson p:",p)
if sample<30:
    print("when sample <30,pearson has no mean")
print("-"*100)
程序结果:
x1和x2的R平方0.83,相关性强 -------暗示变量多重共线性问题
x1和y的R平方0.98,相关性强
x2和y的R平方0.897,相关性强
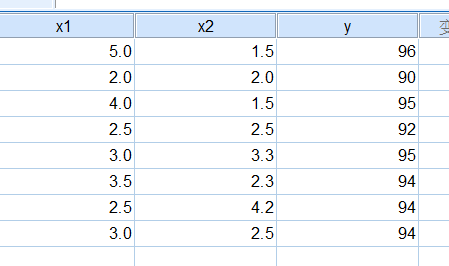
例子2

我们能否用这组数据来建立多元线性回归模型呢?同样再来绘制散点图如下,自变量之间似乎还是有点共线性,但是又不像上面例子中的那么明显,现在该怎么办?

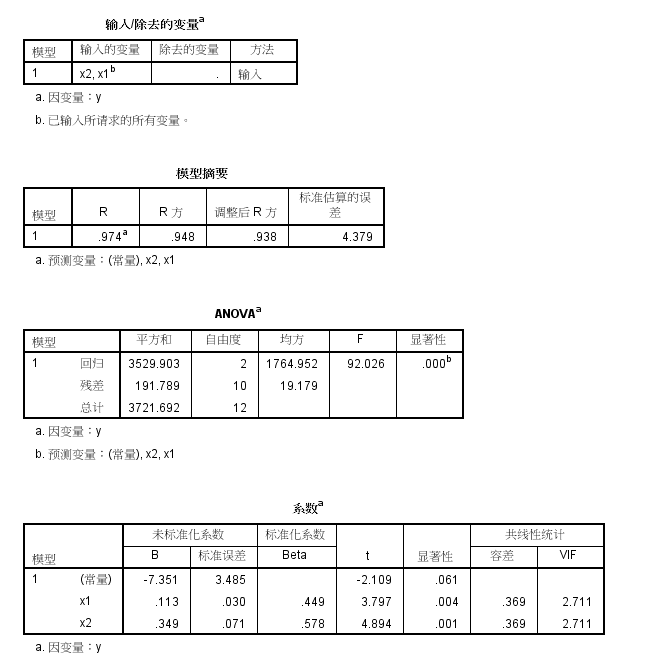
所以我们还是建议采用一种更加能够便于量化的方法来描述问题的严重性,而不是仅仅通过肉眼观察来做感性的决定。下面我演示在SPSS 22中检验多重共线性的方法。首先导入数据,如下所示

然后单击菜单栏上的【分析】->【回归】->【线性...】,则进入如下图所示的线性回归对话框。当选择好因变量和自变量之后,选择右上角的【Statistics...】,然后在弹出的新对话框里选定【共线性诊断】
回到上图左边的对话框之后,选择确定,SPSS给出了线性回归分析的结果。我们来看其中共线性诊断的部分,如下所示,如果有条件指数>10,则表明有共线性。现在最大的是9.659,仍然处于可以接受的范围。

Python脚本
# -*- coding: utf-8 -*-
"""
Created on Thu Feb 22 17:12:03 2018
@author: Administrator
"""
import pandas as pd
from statsmodels.formula.api import ols
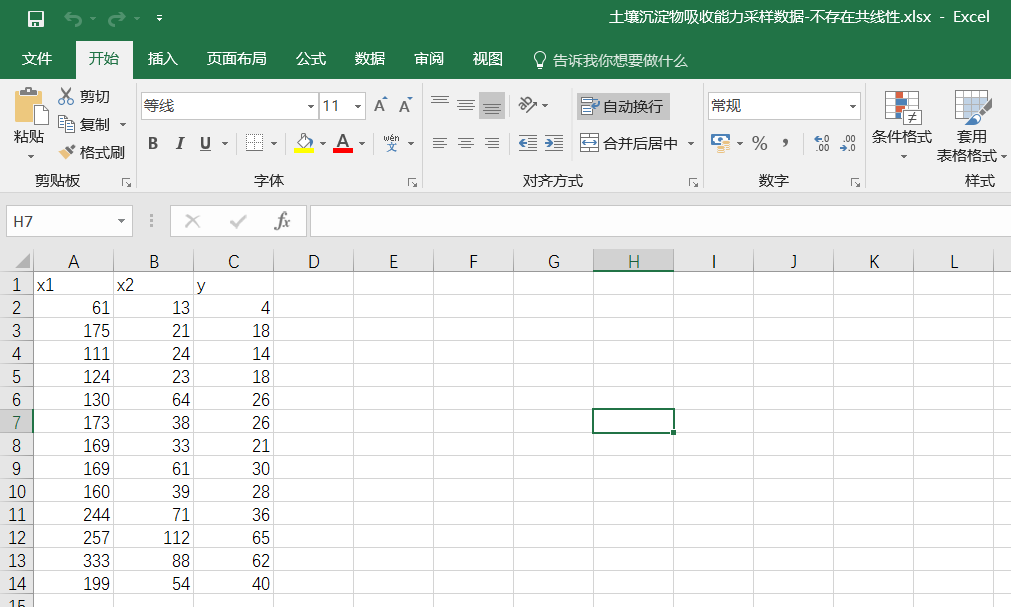
df=pd.read_excel("土壤沉淀物吸收能力采样数据-不存在共线性.xlsx")
#多元回归函数
def MulitiLinear_regressionModel(df):
'''Multilinear regression model, calculating fit, P-values, confidence intervals etc.'''
# --- >>> START stats <<< ---
# Fit the model
model = ols("y ~ x1 + x2", df).fit()
# Print the summary
print((model.summary()))
# --- >>> STOP stats <<< ---
return model._results.params # should be array([-4.99754526, 3.00250049, -0.50514907])
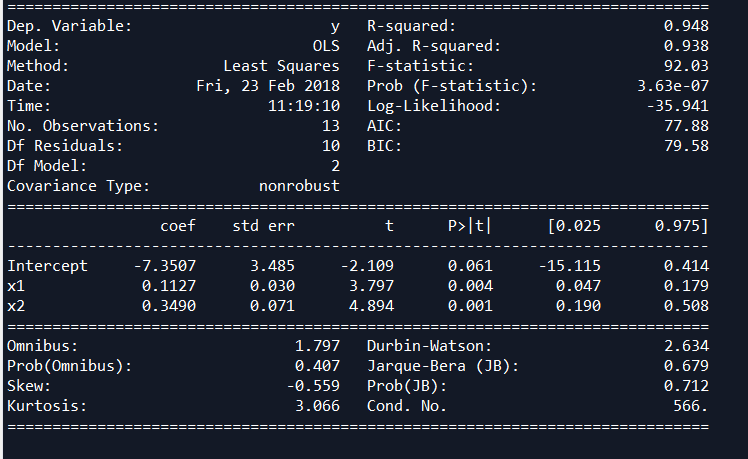
MulitiLinear_regressionModel(df)
condition num=566
R平方=0.948,和spss一样准确
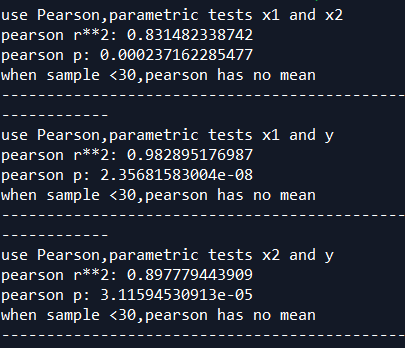
x1和x2, x1和y,x2和y的相关系数对比
# -*- coding: utf-8 -*-
"""
Created on Thu Feb 22 11:35:50 2018

@author: Administrator
"""
import pandas as pd
import scipy.stats as stats


df=pd.read_excel("土壤沉淀物吸收能力采样数据-不存在共线性.xlsx")
array_values=df.values
x1=[i[0] for i in array_values]
x2=[i[1] for i in array_values]
y=[i[2] for i in array_values]
sample=len(x1)


print("use Pearson,parametric tests x1 and x2")
r,p=stats.pearsonr(x1,x2)
print("pearson r**2:",r**2)
print("pearson p:",p)
if sample<30:
    print("when sample <30,pearson has no mean")
print("-"*100)

print("use Pearson,parametric tests x1 and y")
r,p=stats.pearsonr(x1,y)
print("pearson r**2:",r**2)
print("pearson p:",p)
if sample<30:
    print("when sample <30,pearson has no mean")
print("-"*100)


print("use Pearson,parametric tests x2 and y")
r,p=stats.pearsonr(x2,y)
print("pearson r**2:",r**2)
print("pearson p:",p)
if sample<30:
    print("when sample <30,pearson has no mean")
print("-"*100)
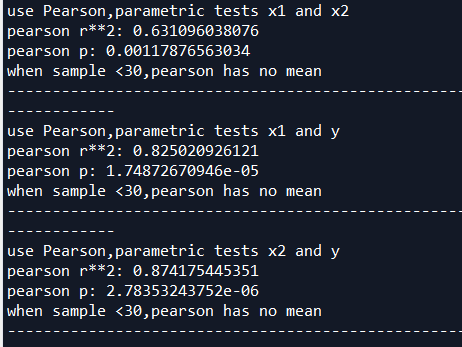
程序结果:
x1和x2的R平方0.63,相关性弱
x1和y的R平方0.825,相关性强
x2和y的R平方0.874,相关性强
案例
# -*- coding: utf-8 -*-
"""
Created on Thu Feb 22 11:35:50 2018
@author: Administrator
"""
import pandas as pd
import scipy.stats as stats
df=pd.read_excel("两元回归测试.xlsx")
array_values=df.values
x1=[i[0] for i in array_values]
x2=[i[1] for i in array_values]
y=[i[2] for i in array_values]
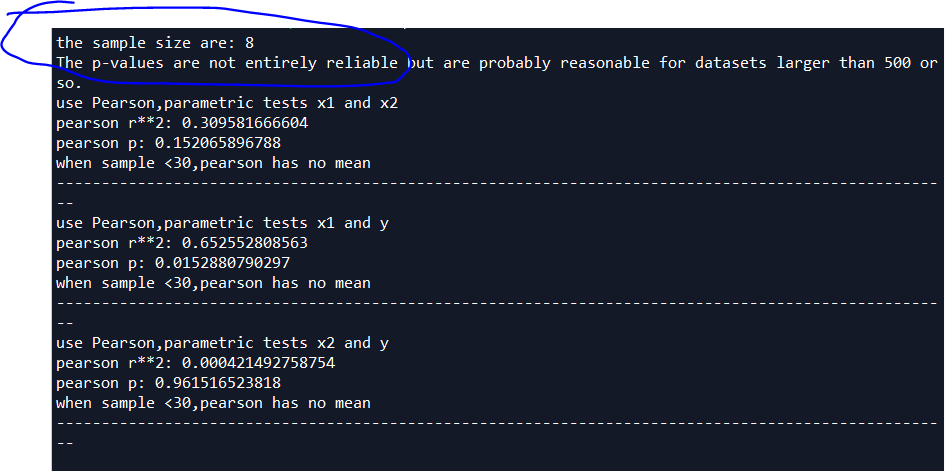
sample=len(x1)
if sample<500:
print("the sample size are:",sample)
print("The p-values are not entirely reliable but are probably reasonable for datasets larger than 500 or so.")
print("use Pearson,parametric tests x1 and x2")
r,p=stats.pearsonr(x1,x2)
print("pearson r**2:",r**2)
print("pearson p:",p)
if sample<30:
print("when sample <30,pearson has no mean")
print("-"*100)
print("use Pearson,parametric tests x1 and y")
r,p=stats.pearsonr(x1,y)
print("pearson r**2:",r**2)
print("pearson p:",p)
if sample<30:
print("when sample <30,pearson has no mean")
print("-"*100)
print("use Pearson,parametric tests x2 and y")
r,p=stats.pearsonr(x2,y)
print("pearson r**2:",r**2)
print("pearson p:",p)
if sample<30:
print("when sample <30,pearson has no mean")
print("-"*100)
python信用评分卡建模(附代码,博主录制)