简介
在实际的配置中,经常会遇到增加或者减少监控主机的状况,如果每次都需要修改
prometheus.yml配置文件,实在是太麻烦了。
此时就需要配置自动发现,而prometheus只是很多种的自动发现
支持:
- 基于公有云
- 基于私有云
- 基于文件,file的自动发现
- 基于DNS 的自动发现,分为SRV解析自动发现和A记录解析的自动发现
........等等,有很多类型,本文中介绍基于静态文件 和 DNS 的自动发现
环境说明
增加一台 10.0.20.12 node_export 主机及DNS使用的是bind9
如需bind9 文档,点击这里是bind9文档
以下的所有演示都是案例,可根据自己的情况做变更。
静态配置
简单讲解下直接修改prometheus.yml主配置文件中的静态配置。
修改配置如下:
[root@es01 config]# cat prometheus.yml
global:
  scrape_interval:     15s
  evaluation_interval: 15s
alerting:
  alertmanagers:
  - static_configs:
    - targets:

rule_files:

scrape_configs:
  - job_name: 'prometheus'
    static_configs:
    - targets: ['localhost:9090']

  - job_name: 'node'                # 增加一个节点,取名为 node
    metrics_path: '/metrics'        # 获取数据的路径 http://10.0.20.12:9100/metrics
    static_configs:
    - targets: ['10.0.20.12:9100']  # 静态配置 node 节点的地址
重新加载配置文件
检查配置文件,并重新加载
# 检查配置文件
[root@es01 config]# /opt/prometheus-2.14/bin/promtool check config /opt/prometheus-2.14/config/prometheus.yml
Checking /opt/prometheus-2.14/config/prometheus.yml
  SUCCESS: 0 rule files found

# 重新加载配置文件
[root@es01 config]# curl -X POST httP://10.0.20.11:9090/-/reload
[root@es01 config]#
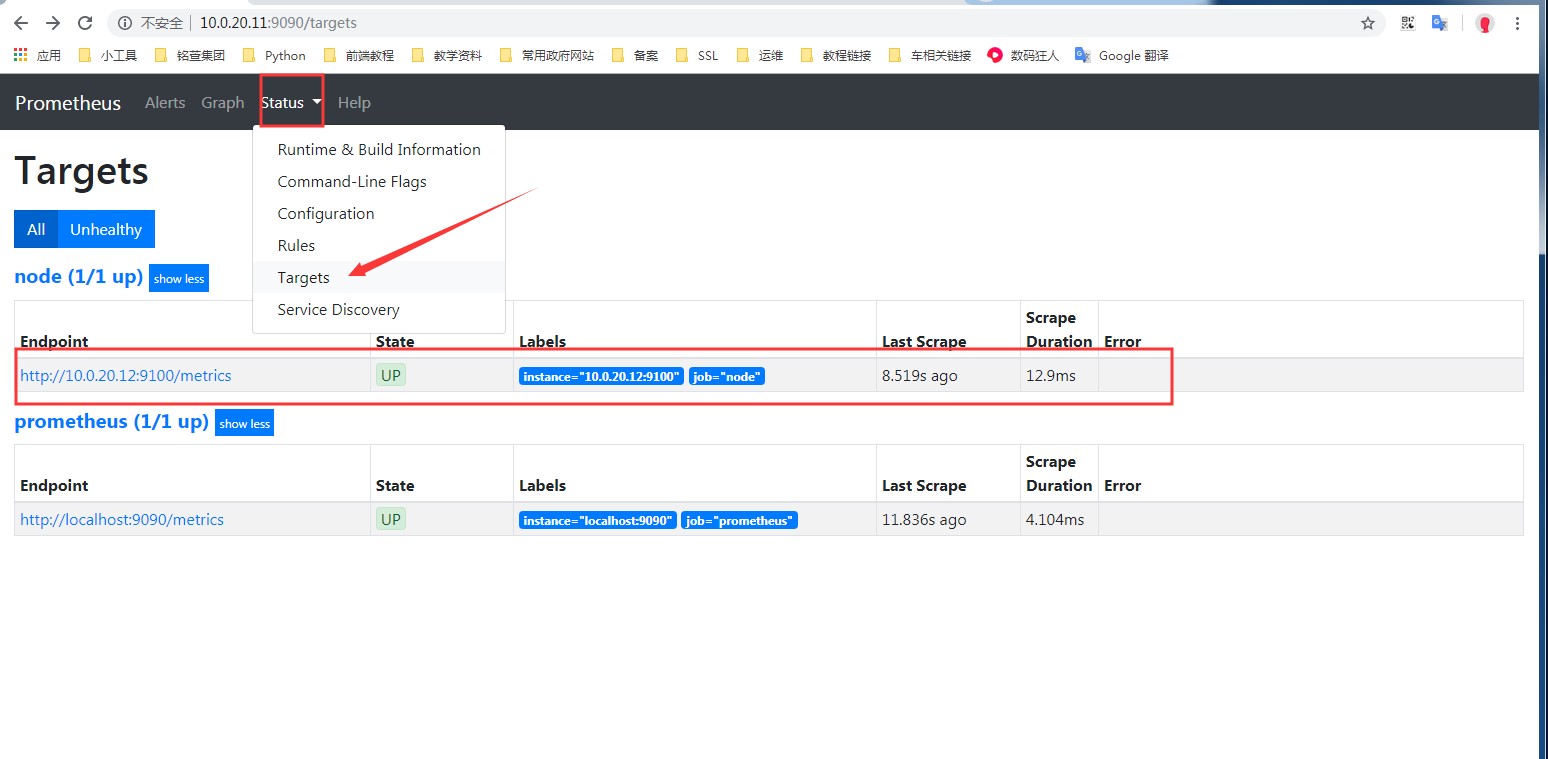
再次访问效果如下
基于文件发现配置
创建对应的目录
[root@es01 config]# pwd
/opt/prometheus-2.14/config
# 创建targets目录,并且创建对应的子目录,用于存放相应的配置文件自动发现
[root@es01 config]# mkdir targets/{docker,nodes}
[root@es01 config]# ls targets/
docker  nodes
在创建好的nodes目录下创建 nodes.json文件,并写入下面内容
[root@es01 config]# cat targets/nodes/nodes.json
[{
  "targets": [
    "10.0.20.12:9100"           # 指定node_export链接地址
  ],
  "labels": {
    "server": "node_export01"   # 添加一个标签
  }
}]
修改配置文件如下:
[root@es01 config]# cat prometheus.yml
global:
  scrape_interval:     15s
  evaluation_interval: 15s
alerting:
  alertmanagers:
  - static_configs:
    - targets:

rule_files:

scrape_configs:
  - job_name: 'prometheus'
    static_configs:             # 这个配置表示 静态发现
    - targets: ['localhost:9090']

  - job_name: 'node'            # 增加一个节点,取名为 node
    metrics_path: "/metrics"    # 获取数据的路径 http://10.0.20.12:9100/metrics
    file_sd_configs:            # 这个配置表示通过文件发现
    - files:
      - targets/nodes/*.json    # 读取目录下的所有json结尾的文件
      refresh_interval: 1m      # 刷新频率,1 分钟
重新加载配置文件
检查配置文件,并重新加载
# 检查配置文件
[root@es01 config]# /opt/prometheus-2.14/bin/promtool check config /opt/prometheus-2.14/config/prometheus.yml
Checking /opt/prometheus-2.14/config/prometheus.yml
  SUCCESS: 0 rule files found

# 重新加载配置文件
[root@es01 config]# curl -X POST httP://10.0.20.11:9090/-/reload
[root@es01 config]#
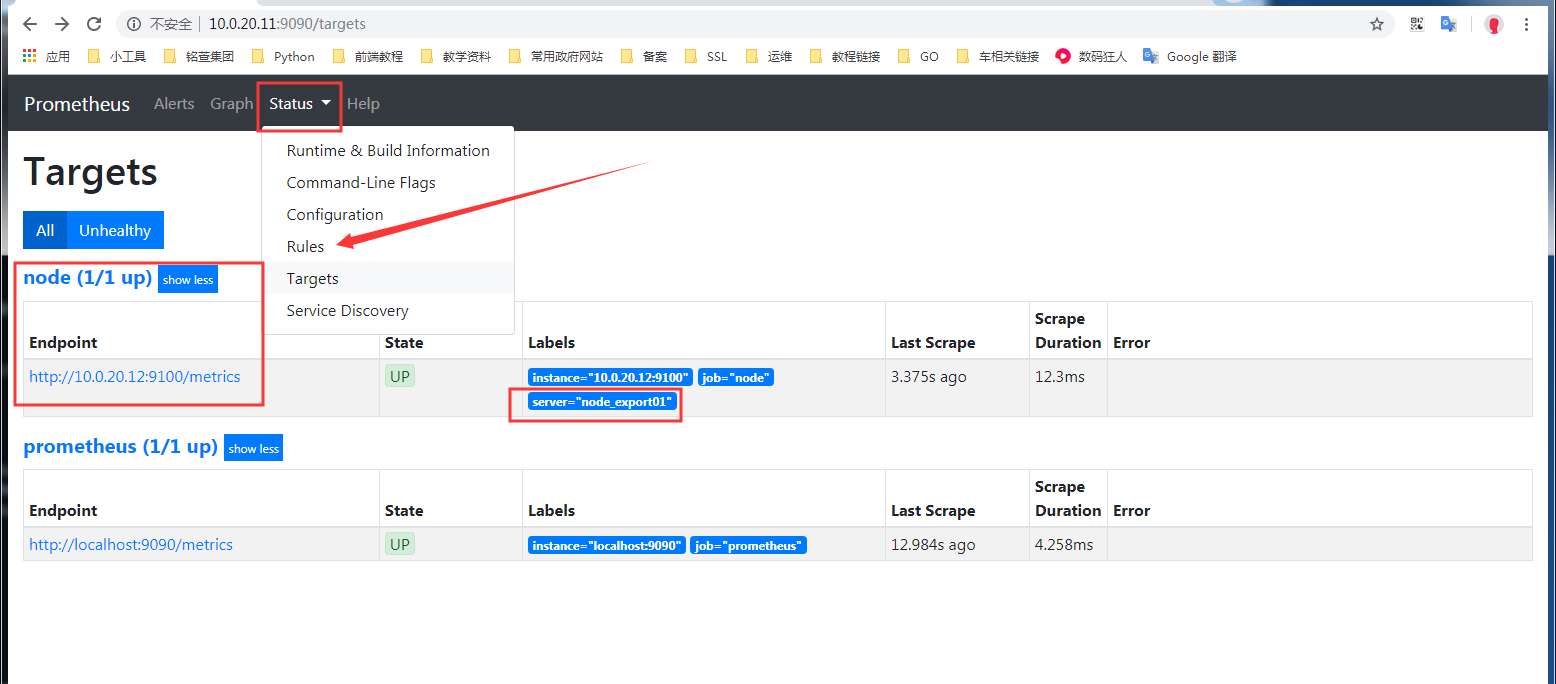
可以看到,获取到了主机监控,并且能看到增加标签
添加主机测试
在配置文件 targets/nodes/nodes.json 中添加一台主机。
在前面的文档中,prometheus 主机也部署了node_export ,这里添加测试
[{
  "targets": [
    "10.0.20.11:9100",
    "10.0.20.12:9100"
  ],
  "labels": {
    "server": "node_export01"
  }
}]
当编辑文件 targets/nodes/nodes.json 后保存,再次访问页面时,新增加的主机已经自动加入
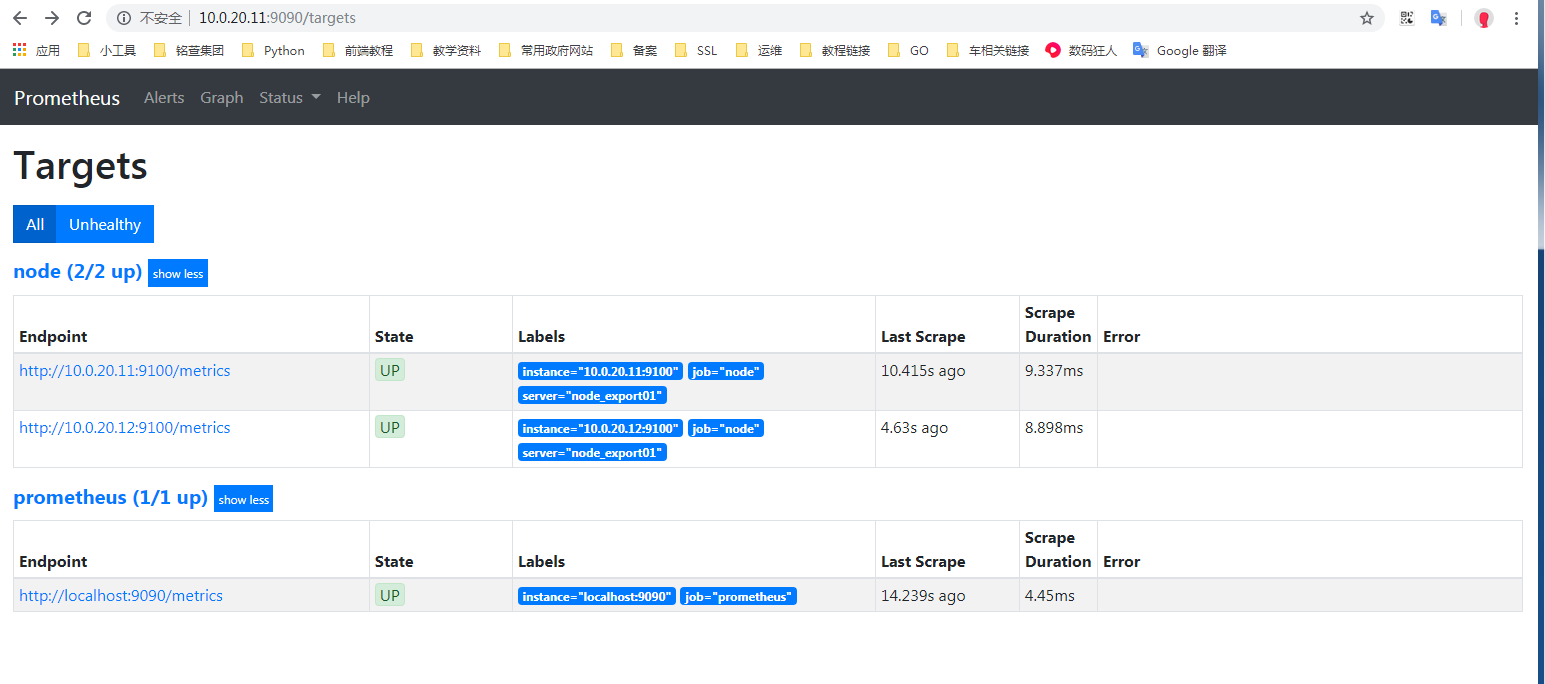
简单总结: 定义好对应的主配置文件prometheus.yml后,后续要添加新的node节点监控进来,只需要增加node.json内容即可,也不需要重载prometheus服务,相对比较简单的基于文件的自动发现。
基于DNS的A记录
首先要在内网DNS上添加A记录解析:
[root@es01 config]# nslookup es01.k8s.com
Server:		192.168.1.122
Address:	192.168.1.122#53

Name:	es01.k8s.com
Address: 10.0.20.11         # 解析后的地址

[root@es01 config]# nslookup es02.k8s.com
Server:		192.168.1.122
Address:	192.168.1.122#53

Name:	es02.k8s.com
Address: 10.0.20.12         # 解析后的地址
这里添加了两条A记录
修改配置文件
[root@es01 config]# cat prometheus.yml
global:
  scrape_interval:     15s
  evaluation_interval: 15s
alerting:
  alertmanagers:
  - static_configs:
    - targets:

rule_files:

scrape_configs:
  - job_name: 'prometheus'
    static_configs:
    - targets: ['localhost:9090']

  - job_name: 'node-A'                  # 名称
    metrics_path: "/metrics"            # 获取数据的路径 http://10.0.20.12:9100/metrics
    dns_sd_configs:
    - names: ["es01.k8s.com", "es02.k8s.com"]   # 这里填写A记录
      type: A                                   # 解析类型 A记录
      port: 9100                                # 端口
重新加载配置文件
检查配置文件,并重新加载
# 检查配置文件
[root@es01 config]# /opt/prometheus-2.14/bin/promtool check config /opt/prometheus-2.14/config/prometheus.yml
Checking /opt/prometheus-2.14/config/prometheus.yml
  SUCCESS: 0 rule files found

# 重新加载配置文件
[root@es01 config]# curl -X POST httP://10.0.20.11:9090/-/reload
[root@es01 config]#
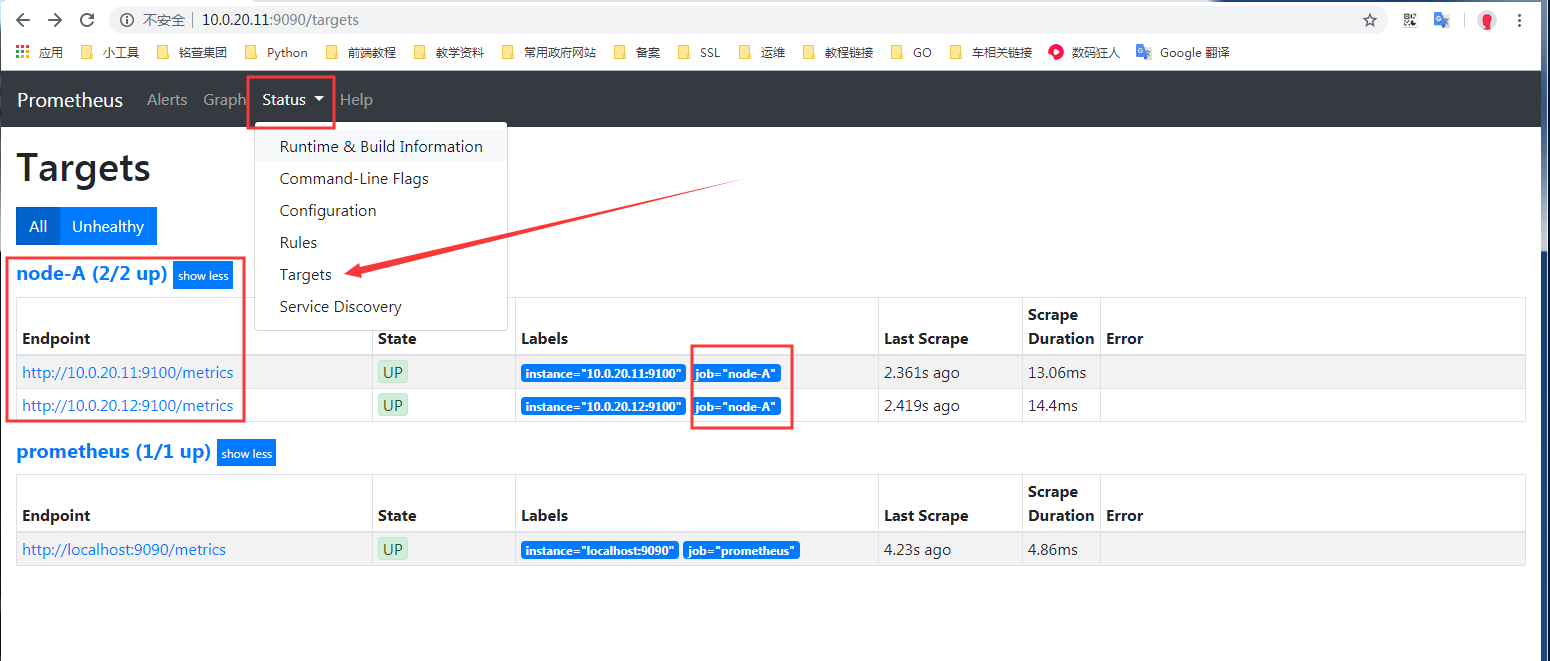
通过上图可以看出添加成功。
基于DNS的SRV记录自动发现
需要在DNS中添加SRV解析记录,下面演示在bind9中添加后测试
首先要在内网DNS上添加A记录解析:
[root@es01 config]# nslookup es01.k8s.com
Server:		192.168.1.122
Address:	192.168.1.122#53

Name:	es01.k8s.com
Address: 10.0.20.11         # 解析后的地址
然后添加SRV记录:
[root@bind named]# cat k8s.com.zone
es01    IN      A       10.0.20.11
_prometheus._tcp.k8s.com.       IN      SRV     10      10      9100    es01
上述是在bind中添加的对应的A记录和SRV记录
解析SRV记录测试
[root@es01 config]# dig @192.168.1.122 +noall +answer SRV _prometheus._tcp.k8s.com
_prometheus._tcp.k8s.com. 86400	IN	SRV	10 10 9100 es01.k8s.com.
能够解析到上述内容,则表示SRV记录添加正常
注意,先添加es01,之后测试添加SRV后,prometheus能否动态添加进监控
修改配置文件
[root@es01 config]# cat prometheus.yml
global:
scrape_interval: 15s
evaluation_interval: 15s
alerting:
alertmanagers:
- static_configs:
- targets:
rule_files:
scrape_configs:
- job_name: 'prometheus'
static_configs:
- targets: ['localhost:9090']
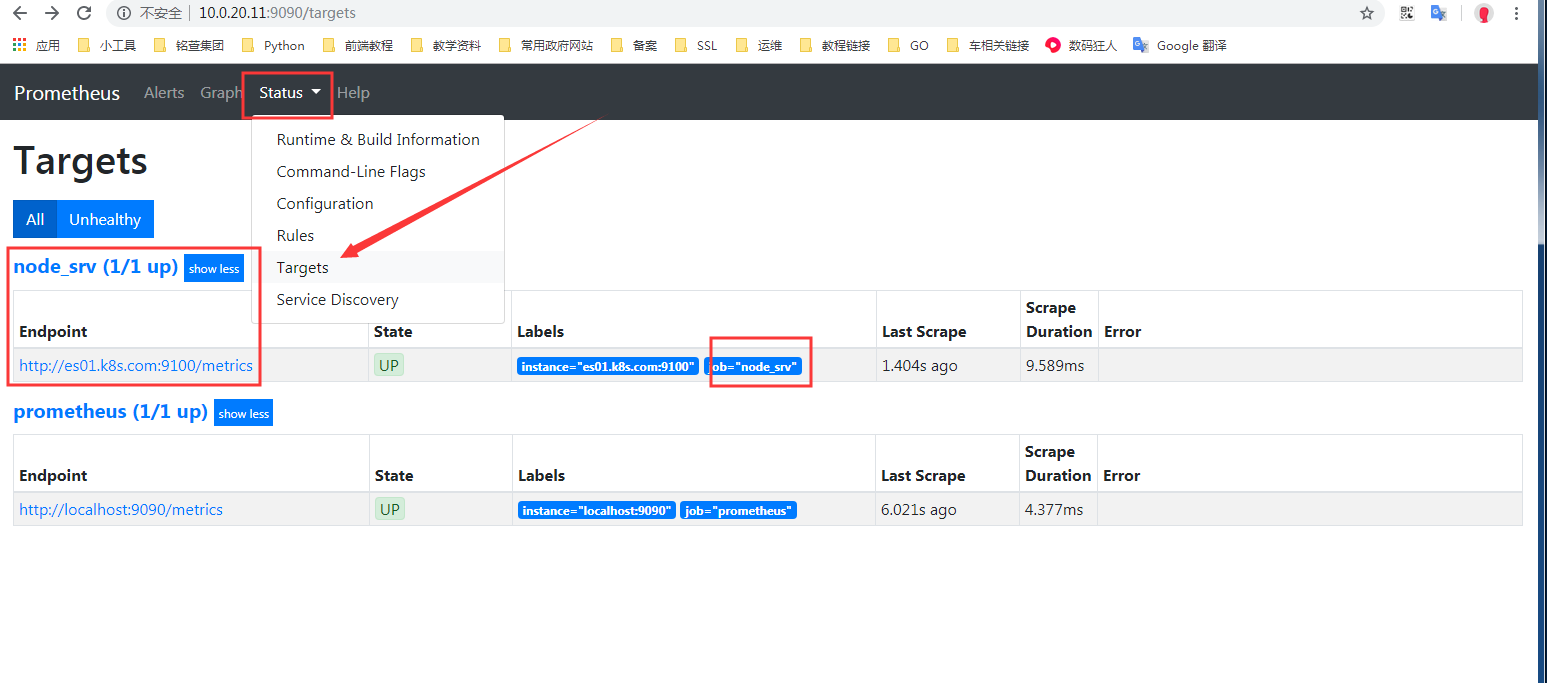
- job_name: 'node_srv' # 名称
metrics_path: "/metrics" # 获取数据的路径 http://10.0.20.12:9100/metrics
dns_sd_configs: # 配置使用DNS解析
- names: ['_prometheus._tcp.k8s.com'] # 配置SRV对应的解析地址
重新加载配置文件
检查配置文件,并重新加载
# 检查配置文件
[root@es01 config]# /opt/prometheus-2.14/bin/promtool check config /opt/prometheus-2.14/config/prometheus.yml
Checking /opt/prometheus-2.14/config/prometheus.yml
  SUCCESS: 0 rule files found

# 重新加载配置文件
[root@es01 config]# curl -X POST httP://10.0.20.11:9090/-/reload
[root@es01 config]#
动态添加解析测试
上面通过SRV已经可以监控了,这里再次测试下,添加一条SRV记录后,prometheus是否能够自动添加
添加记录并测试
首先要在内网DNS上添加A记录解析:
[root@es01 config]# nslookup es01.k8s.com
Server:		192.168.1.122
Address:	192.168.1.122#53

Name:	es01.k8s.com
Address: 10.0.20.11         # 解析后的地址

[root@es01 config]# nslookup es02.k8s.com
Server:		192.168.1.122
Address:	192.168.1.122#53

Name:	es02.k8s.com
Address: 10.0.20.12         # 解析后的地址
然后添加SRV记录:
[root@bind named]# cat k8s.com.zone
es01    IN      A       10.0.20.11
es02    IN      A       10.0.20.12
_prometheus._tcp.k8s.com.       IN      SRV     10      10      9100    es01
_prometheus._tcp.k8s.com.       IN      SRV     10      10      9100    es02
上述是在bind中添加的对应的A记录和SRV记录
解析SRV记录测试
[root@es01 config]# dig @192.168.1.122 +noall +answer SRV _prometheus._tcp.k8s.com
_prometheus._tcp.k8s.com. 86400	IN	SRV	10 10 9100 es01.k8s.com.
_prometheus._tcp.k8s.com. 86400	IN	SRV	10 10 9100 es02.k8s.com.
添加SRV解析成功后访问测试:
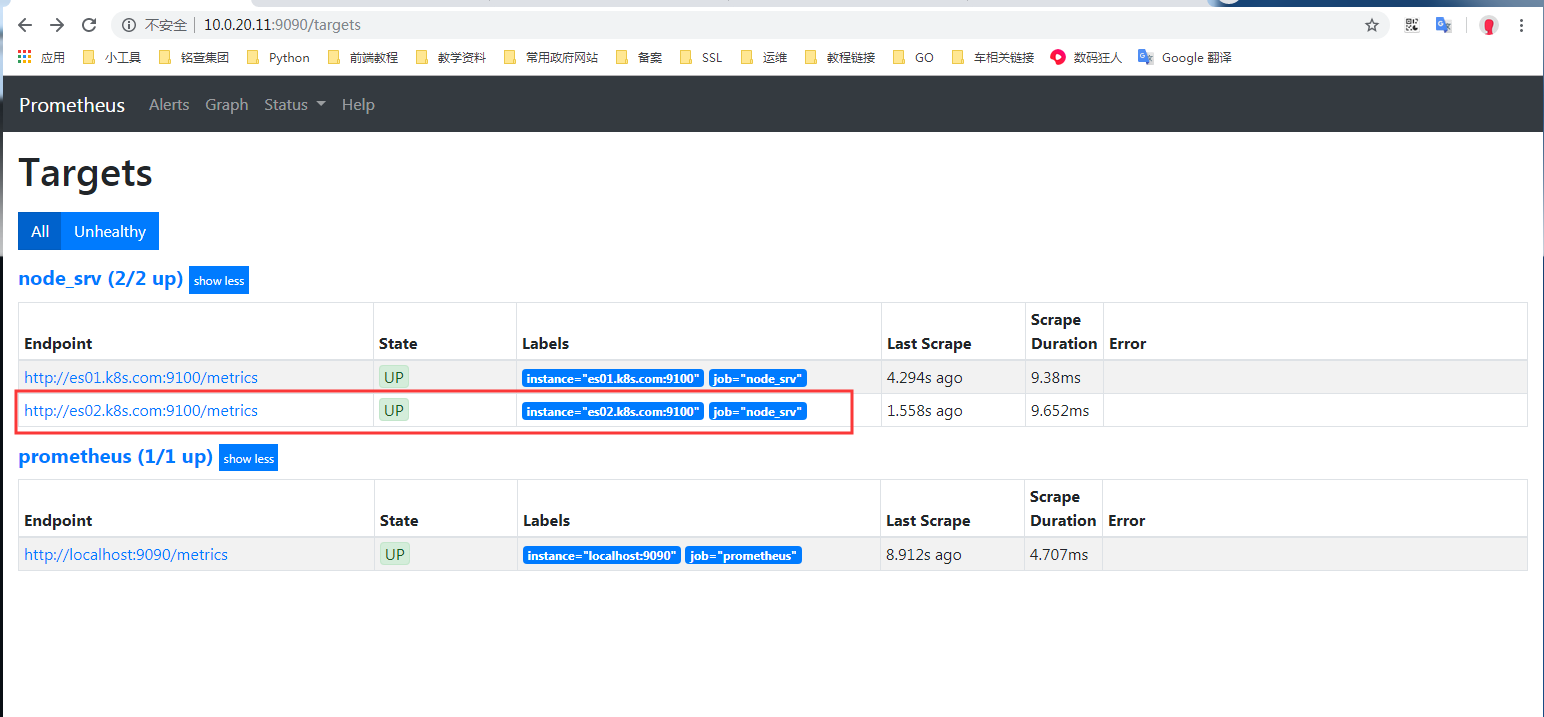
上图中展示,已自动添加成功。