Why Dr.Elephant?
- Most of Hadoop optimization tools out there, but they are focused on simplifying the deploy and managment of Hadoop clusters.
- Very few tools are designed to help Hadoop users optimize their flows.
- Dr.Elephant supports Hadoop with a variety of frameworks and can be easily extended to newer frameworks.
- You can plugin and configure as many custom heuristics as you like.
- It is designed to help the users of Hadoop and Spark understand the internals of their flow and to help them tune their jobs easily.
Key Features
- Pluggable and configurable rule-based heuristics that diagnose a job;
- Out-of-the-box integration with Azkaban scheduler and support for adding any other Hadoop scheduler, such as Oozie;
- Representation of historic performance of jobs and flows;
- Job-level comparison of flows;
- Diagnostic heuristics for MapReduce and Spark;
- Easily extensible to newer job types, applications, and schedulers;
- REST API to fetch all the information.
How does it work?
- Dr. Elephant gets a list of all recent succeeded and failed applications, at regular intervals, from the YARN resource manager.
- The metadata for each application—namely, the job counters, configurations, and the task data—are fetched from the Job History server.
- Dr. Elephant runs a set of heuristics on them and generates a diagnostic report on how the individual heuristics and the job as a whole performed.
- These are then tagged with one of five severity levels, to indicate potential performance problems.
Sample Usage
- Once a job completes, it can be found in the Dashboard.
- The color Red means the job is in critical state and requires tuning while Green means the job is running efficiently. As follow
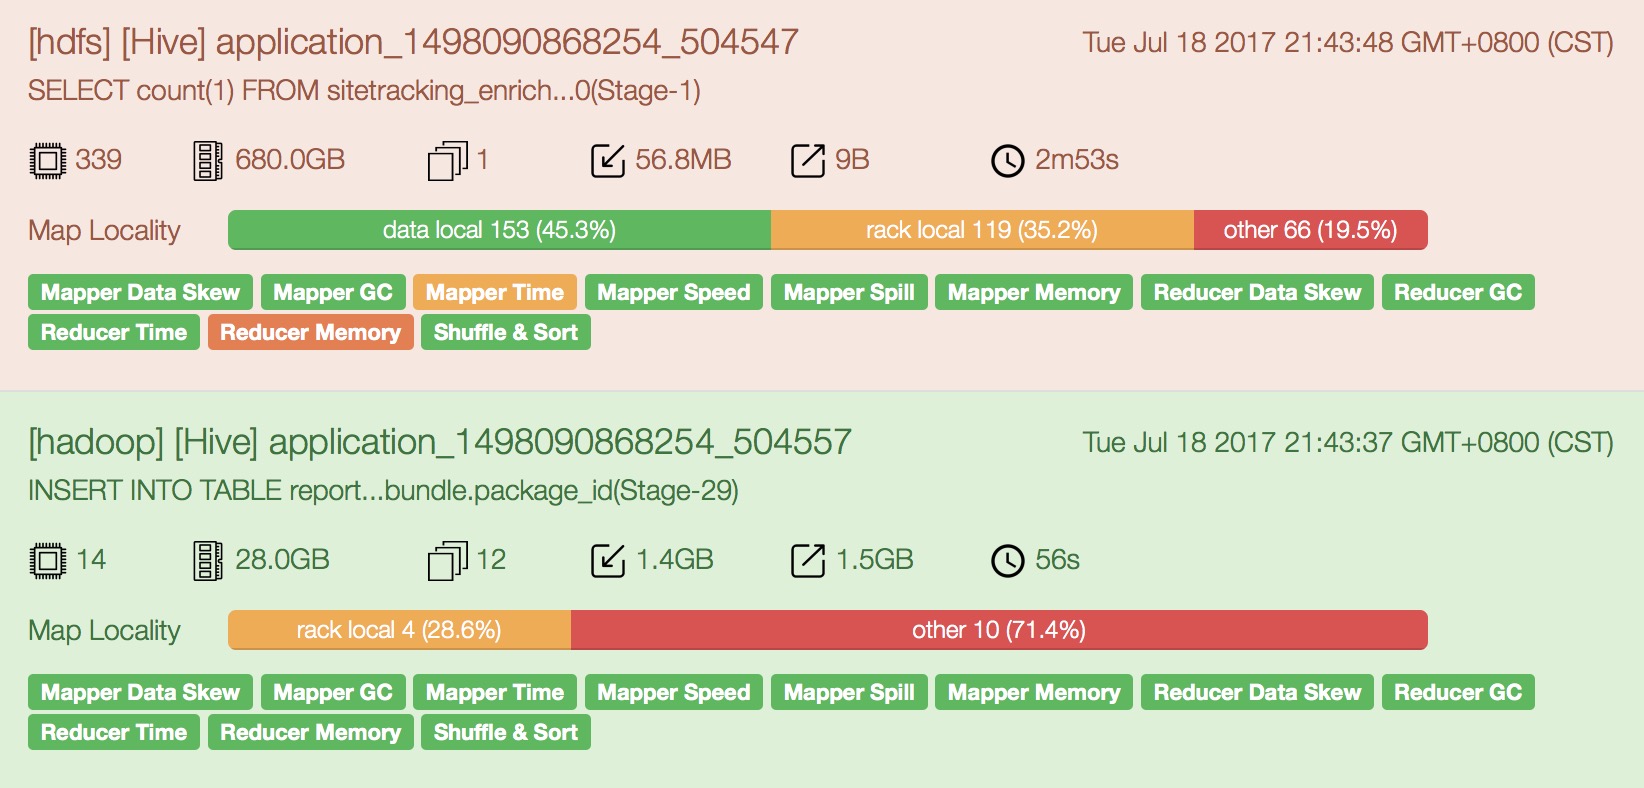
- And u can click into the app to get the complete report, including details on each of the individual heuristics and a link, [Explain], which provides suggestions on how to tune the job to improve that heuristic.
Getting Started
User Guide
- Dashboard
- Cluster Statistics
- Latest Analysis
- Search Page
- Job Details
- Some useful links: Job tracker、Job execution、Job definition、Flow definition、Job History、Flow History、Metrics
- Heuristic Results:
- Each heuristic will compute a severity which may be one of none, low, moderate, severe, critical.
- When a job is moderate, severe or critical, a link is provided which points to the help page for the specific heuristic.
- Compare: U can compare two different flow executions at a job level.
- The common jobs will be compared and shown at the top.
- Other jobs will be shown with jobs from first flow followed by jobs from second flow.
- Job History Page:
The job history page shows a historical comparison of all the recent executions of a particular job.
- Search box: takes a single parameter which is the job's definition ID or the Url in case of Azkaban.
- Heuristics Graph(Performance score graph): A graph of the recent executions on the X axis against the performance score on the Y axis. The formula of score:
int score = 0; if (severity != Severity.NONE && severity != Severity.LOW) { score = severity.getValue() * tasks; } return score; - Metrics Graph(Time and Resources): Metrics including used resources
- Flow History Page: shows a historical comparison of all the recent executions of a particular flow.
Heuristics
Tuning Tips
- U can use Dr.Elephant to analyze ur job, and it will point out areas that could use tuning as well as suggestions on which parameters to adjust.
Speeding Up ur Workflow
- In particular, pay attention to settings such as number of maps, number of reducers, io.* settings, memory settings, and number of files generated.
- Changing some of these to better match your job requirements can have significant savings.
General Advice
- Tuning each step is important
- FIle count vs. block count: One large file over 10 smaller files
- Java task memory management: By default, a maximum of 2G memory per map/reduce task is allocated. For Java-jobs, this usually translates to 1G of heap (Xmx) and .5-1G of non-heap. For certaain jobs this isn't enough memory.
- Use compressedOops:
A 32bit JVM uses 32-bit unsigned integers to reference memory locations, which leads to a max heap size of (2^32 -1) = 4GB. A 64-bit JVM uses 64-bit longs instead, which leads to (2^64 - 1) = 16 exabytes of maximum heap space. Awesome! However, by using longs instead of ints, the memory footprint of your application will grow. Some say by even 1.5 times. This could push you beyond that 1G limit of heap. What can you do about it? All modern JVMs support an option called CompressedOops which represents pointers as 32-bit integers instead of 64-bit longs in some of the cases. This will reduce the memory footprint, though not back to that of a 32-bit. You can turn this option on by doing the following in your azkaban job file:
hadoop-inject.mapreduce.(map|reduce).java.opts=-Xmx1G -XX:+UseCompressedOops
- UseCompressedStrings:
This will convert String types to a compressed byte[] format.
To enable, add -XX:+UseCompressedStrings to your mapreduce.
- Use compressedOops:
- Key Tuning Parameters
- Mappers
- mapreduce.input.fileinputformat.split.minsize
The minimum size chunk that map input should be split into.
By increasing this value beyond dfs.blocksize, you can reduce the number of mappers in your job.
If u set it to 4x dfs.blocksize, then 4 times the size of blocks will be sent to a single mapper, thus, reducing the number of mappers needed to process ur input. - mapreduce.input.fileinputformat.split.maxsize
The maximum size chunk that map input should be split into when using CombineFileInputFormat or MultiFileInputFormat.
By decreasing this value below dfs.blocksize, you can increase the number of mappers in your job.
- mapreduce.input.fileinputformat.split.minsize
- Reducers
- mapreduce.job.reduces
One of the biggest killers for workflow performance is the total number of reducers in use.
Determining the number of reducers of individual jobs is a bit of art. But here are some guidelines to think about when picking the number:
- More reducers = more files on the namenode Too many small files bogs down the namenode and may ultimately make it crash. So if your reduce output is small (less than 512MB), you want fewer reducers
- More reducers = less time spent processing data If you have too few reducers, your reduce tasks may take significantly longer than they should. The faster your jobs' reducers run, the more jobs we can push through the grid.
- mapreduce.job.reduce.slowstart.completedmaps
This setting controls what percentage of maps should be complete before a reducer is started.
By default, we set this to 80%. The two factors to consider are:- how much data will each reducer get
- how long each remaining map will take
If the map output is significant, it is generally recommended that reducers start earlier so that they have a head start processing. If the maps tasks do not produce a lot of data, then it is generally recommended that reducers start later.
- mapreduce.job.reduces
- Compression
- mapreduce.map.output.compress: set to true will reduce internode transfers, however care must be taken that the time to compress and uncompress is faster than the time to transfer.
- Memory
- mapreduce.(map|reduc).memory.mb
This allows for the system to better manager resources on a busy system. In order to request more memory for your task slot you need to adjust both the Xmx value and the mapreduce.(map|reduce).memory.mb value.
- mapreduce.(map|reduc).memory.mb
- Advanced
- Controlling the number of spills / io.sort.record.percent
io.sort.record.percent controls how much of the circular buffer is used for record vs. record metadata.
- Controlling the number of spills / io.sort.record.percent
- Mappers
Hive
- mapreduce.input.fileinputformat.split.minsize
- mapreduce.input.fileinputformat.split.maxsize
- mapreduce.input.fileinputformat.split.minsize.per.node
- mapreduce.input.fileinputforomat.split.minsize.per.rack
Metrics and Heuristics
- TBD
- refer to