zoukankan      html  css  js  c++  java
  • highcharts

    好久没分享东西了,然后想想还是来分享点现成又好用的东西吧,摸了一年的PHP,发现自己所知还是甚浅。前两天又被调到公司的产品组里,也就用到了这个叫highcharts插件的东西。

    因为目前项目刚起步,很多数据表跟接口都没有出来,数据都是用自己造的数据替代的,大家就将就看下吧.

    一些引用的东西,我就不贴了.只贴代码:

    JS:

      1 /**
      2  * 
      3  */
      4 $(function(){
      5 
      6     var chartConfig = {};
      7     // 饼图的配置参数
      8     chartConfig.pieChartConfig = {
      9             chart: {
     10                 plotBackgroundColor: null,
     11                 plotBorderWidth: null,
     12                 plotShadow: false,
     13                 backgroundColor:'#FBFBFB',
     14             },
     15             credits:{
     16                 enabled:false
     17             },
     18             exporting:{
     19                 enabled:false
     20             },
     21             legend: {
     22                 enabled:true,
     23                 align:'right',
     24                 layout:'vertical',
     25                 verticalAlign:'middle',
     26                 symbolRadius:15
     27             },
     28             title: {
     29                 text: ''
     30             },
     31             tooltip: {
     32                 pointFormat: '{series.name}: <b>{point.percentage:.1f}%</b>'
     33             },
     34             plotOptions: {
     35                 pie: {
     36                     allowPointSelect: true,
     37                     cursor: 'pointer',
     38                     dataLabels: {
     39                         enabled: true,
     40                         format: '{point.percentage:.1f} %',
     41                         style: {
     42                             color: (Highcharts.theme && Highcharts.theme.contrastTextColor) || 'black'
     43                         },
     44                         inside:true,
     45                     },
     46                     innerSize:50,
     47                     showInLegend:true
     48                 }
     49             },
     50             series: [{
     51                 type: 'pie',
     52                 name: '错题来源',
     53                 data: [
     54                        ['课堂互动',30],
     55                        ['考试',30],
     56                        ['作业',40]
     57                        ],
     58                 dataLabels:{
     59                     reserveSpace:false
     60                 }
     61             }]
     62     };
     63     
     64     // 柱状图的配置参数
     65     chartConfig.barChartConfig = {
     66             chart: {
     67                 type: 'bar'
     68             },
     69             credits:{
     70                 enabled:false
     71             },
     72             exporting:{
     73                 enabled:false
     74             },
     75             title: {
     76                 text: '出错原因分析'
     77             },
     78             xAxis: {
     79                 categories: ['题型不会', '不会做/概念不清/记忆不清', '考试时间不够', '计算错误/题目看错','其他']
     80             },
     81             yAxis: {
     82                 min: 0,
     83                 title: {
     84                     text: '答题人数'
     85                 }
     86             },
     87             legend: {
     88                 enabled: false
     89             },
     90             plotOptions: {
     91                 series: {
     92                     stacking: 'normal'
     93                 }
     94             },
     95             series: [{
     96                 name: '人数',
     97                 data: [{'color':'#F6BD0F','y':2}, 
     98                    {'color':'#AFD8F8','y':5}, 
     99                    {'color':'#8BBA00','y':9}, 
    100                    {'color':'#FF8E46','y':12}, 
    101                    {'color':'#008E8E','y':15}]
    102             }]
    103         };
    104 
    105 //    var layerOpen = {
    106 //            overview:function(id,title){
    107 //                //页面层
    108 //                layer.open({
    109 //                    type: 1,
    110 //                    title:title,
    111 //                    shade:0.5,
    112 //                    area: ['580px', '390px'], //宽高
    113 //                    content: $('#'+id)
    114 //                });
    115 //            },
    116 //    };
    117     $('#pie-container').highcharts(chartConfig.pieChartConfig);
    118     $('#bar-container').highcharts(chartConfig.barChartConfig);
    119 //    // 点击总览弹出图表的统计信息
    120 //    $('.btn-totalview').click(function(){
    121 //        layerOpen.overview('pie-container','总览');    
    122 //    });
    123 //
    124 //    // 答题统计弹出的图表
    125 //    $('.btn-totalpro').click(function(){
    126 //        layerOpen.overview('bar-container','答题统计');
    127 //    });
    128 
    129 });
    JS代码

    HTML:

     1 <div class="wrongcon-list mgt30 clearfix">
     2                         <div class="wrong-source mgr25 fl">
     3                             <div class="title clearfix">
     4                                 <h3>错题来源</h3>
     5                             </div>
     6                             <div id="pie-container"  class="wrongsource-con clearfix">
     7                             
     8                             </div>
     9                         </div>
    10                         <div class="wrong-source fl">
    11                             <div class="title clearfix">
    12                                 <h3>出错原因分析</h3>
    13                             </div>
    14                             <div id="bar-container" class="wrongsource-con clearfix">
    15                             
    16                             </div>
    17                         </div>
    18                         
    19                     </div>

    效果图:

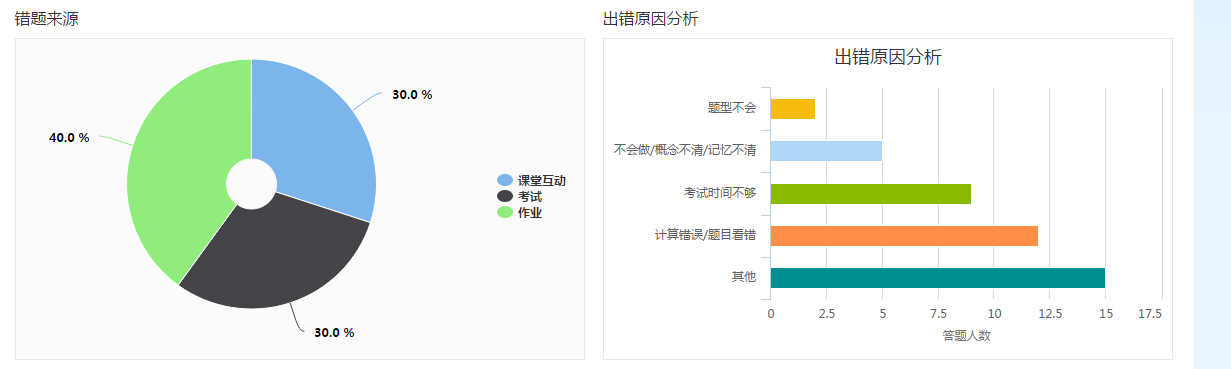
       highcharts官网:http://www.hcharts.cn/

       这东西很简单,只要在项目里引入这个插件,再从html里引入,即可。代码copy过去可以直接用。至于具体的参数是什么意思什么的在这里也就不多说了,网络上一大堆。分享的目的也无非就是弄一个现成的给大家用。

  • 相关阅读:
    winform+c#之窗体之间的传值 Virus
    ASP.NET 2.0 利用 checkbox获得选中行的行号, 在footer中显示 Virus
    .NET中的winform的listview控件 Virus
    我的书橱
    Expert .NET 2.0 IL Assembler·译者序一 写在一稿完成之即
    Verbal Description of Custom Attribute Value
    AddressOfCallBacks in TLS
    下一阶段Schedule
    2008 Oct MVP OpenDay 第二天 博客园聚会
    2008 Oct MVP OpenDay 第二天 颁奖·讲座·晚会
  • 原文地址:https://www.cnblogs.com/wuhaojs/p/5523218.html
Copyright © 2011-2022 走看看