# embedding_in_qt5.py --- Simple Qt5 application embedding matplotlib canvases
#
# Copyright (C) 2005 Florent Rougon
#               2006 Darren Dale
#               2015 Jens H Nielsen
#
# This file is an example program for matplotlib. It may be used and
# modified with no restriction; raw copies as well as modified versions
# may be distributed without limitation.

from __future__ import unicode_literals
import sys
import os
import random
import matplotlib
# Make sure that we are using QT5
matplotlib.use('Qt5Agg')
from PyQt5 import QtCore, QtWidgets

from numpy import arange, sin, pi
from matplotlib.backends.backend_qt5agg import FigureCanvasQTAgg as FigureCanvas
from matplotlib.figure import Figure

progname = os.path.basename(sys.argv[0])
progversion = "0.1"


class MyMplCanvas(FigureCanvas):
    """Ultimately, this is a QWidget (as well as a FigureCanvasAgg, etc.)."""

    def __init__(self, parent=None, width=5, height=4, dpi=100):
        fig = Figure(figsize=(width, height), dpi=dpi)
        self.axes = fig.add_subplot(111)

        self.compute_initial_figure()

        FigureCanvas.__init__(self, fig)
        self.setParent(parent)

        FigureCanvas.setSizePolicy(self,
                                   QtWidgets.QSizePolicy.Expanding,
                                   QtWidgets.QSizePolicy.Expanding)
        FigureCanvas.updateGeometry(self)

    def compute_initial_figure(self):
        pass


class MyStaticMplCanvas(MyMplCanvas):
    """Simple canvas with a sine plot."""

    def compute_initial_figure(self):
        t = arange(0.0, 3.0, 0.01)
        s = sin(2*pi*t)
        self.axes.plot(t, s)


class MyDynamicMplCanvas(MyMplCanvas):
    """A canvas that updates itself every second with a new plot."""

    def __init__(self, *args, **kwargs):
        MyMplCanvas.__init__(self, *args, **kwargs)
        timer = QtCore.QTimer(self)
        timer.timeout.connect(self.update_figure)
        timer.start(1000)

    def compute_initial_figure(self):
        self.axes.plot([0, 1, 2, 3], [1, 2, 0, 4], 'r')

    def update_figure(self):
        # Build a list of 4 random integers between 0 and 10 (both inclusive)
        l = [random.randint(0, 10) for i in range(4)]
        self.axes.cla()
        self.axes.plot([0, 1, 2, 3], l, 'r')
        self.draw()


class ApplicationWindow(QtWidgets.QMainWindow):
    def __init__(self):
        QtWidgets.QMainWindow.__init__(self)
        self.setAttribute(QtCore.Qt.WA_DeleteOnClose)
        self.setWindowTitle("application main window")

        self.file_menu = QtWidgets.QMenu('&File', self)
        self.file_menu.addAction('&Quit', self.fileQuit,
                                 QtCore.Qt.CTRL + QtCore.Qt.Key_Q)
        self.menuBar().addMenu(self.file_menu)

        self.help_menu = QtWidgets.QMenu('&Help', self)
        self.menuBar().addSeparator()
        self.menuBar().addMenu(self.help_menu)

        self.help_menu.addAction('&About', self.about)

        self.main_widget = QtWidgets.QWidget(self)

        l = QtWidgets.QVBoxLayout(self.main_widget)
        sc = MyStaticMplCanvas(self.main_widget, width=5, height=4, dpi=100)
        dc = MyDynamicMplCanvas(self.main_widget, width=5, height=4, dpi=100)
        l.addWidget(sc)
        l.addWidget(dc)

        self.main_widget.setFocus()
        self.setCentralWidget(self.main_widget)

        self.statusBar().showMessage("All hail matplotlib!", 2000)

    def fileQuit(self):
        self.close()

    def closeEvent(self, ce):
        self.fileQuit()

    def about(self):
        QtWidgets.QMessageBox.about(self, "About",
                                    """embedding_in_qt5.py example
Copyright 2005 Florent Rougon, 2006 Darren Dale, 2015 Jens H Nielsen

This program is a simple example of a Qt5 application embedding matplotlib
canvases.

It may be used and modified with no restriction; raw copies as well as
modified versions may be distributed without limitation.

This is modified from the embedding in qt4 example to show the difference
between qt4 and qt5"""
                                )


qApp = QtWidgets.QApplication(sys.argv)

aw = ApplicationWindow()
aw.setWindowTitle("%s" % progname)
aw.show()
sys.exit(qApp.exec_())
#qApp.exec_()
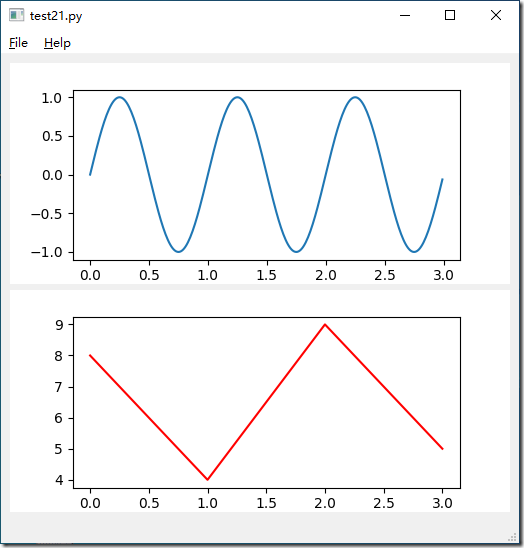
结果如下:
