我们需要知道的是sysbench并不是一个压力测试工具,是一个基准测试工具。linux自带的版本比较低,我们需要自己安装sysbench。
[root@test2 ~]# sysbench --version
sysbench 0.4.12
安装sysbench,sysbench的源码托管在GitHub上,下载源码:
unzip sysbench-master.zip       #解压源码
yum -y install make automake libtool pkgconfig libaio-devel  #下载依赖包
cd sysbench-master
sh autogen.sh
编译:
./configure --with-mysql-includes=/usr/local/mysql/include --with-mysql-libs=/usr/local/mysql/lib   #根据安装的MySQL的位置,设置目录位置
make
make install

这样安装之后使用sysbench命令时会报错。
[root@test3 sysbench-master]# sysbench --version
sysbench: error while loading shared libraries: libmysqlclient.so.20: cannot open shared object file: No such file or directory

解决办法:
在/etc/profile文件中加入一行:
export LD_LIBRARY_PATH=/usr/local/mysql/lib

source /etc/profile
命令可以正常使用
[root@test3 sysbench-master]# sysbench --version
sysbench 1.1.0
查看sysbench的一些帮助信息:
[root@test3 ~]# sysbench --help
Usage:
  sysbench [options]... [testname] [command]

Commands implemented by most tests: prepare run cleanup help

General options:
  --threads=N                     number of threads to use [1]  #线程的数量,默认是1
  --events=N                      limit for total number of events [0]  #限制的最大事件数量,默认是0,不限制
  --time=N                        limit for total execution time in seconds [10]  #整个测试执行的时间
  --warmup-time=N                 #在进行基准测试多少秒之后启用统计信息--forced-shutdown=STRING        #超过--time时间限制后,强制中断,默认是【off】
  --thread-stack-size=SIZE        size of stack per thread [64K]
  --thread-init-timeout=N         wait time in seconds for worker threads to initialize [30]
  --rate=N                        average transactions rate. 0 for unlimited rate [0]
  --report-interval=N             #打印出中间的信念,N表示每隔N秒打印一次,0表示禁用--report-checkpoints=[LIST,...] #转储完全统计信息并在指定时间点复位所有计数器,参数是逗号分隔值的列表,表示从必须执行报告检查点的测试开始所经过的时间(以秒为单位)。 默认情况下,报告检查点处于关闭状态[off]。--debug[=on|off]                print more debugging info [off]
  --validate[=on|off]             #在可能情况下执行验证检查,默认是[off]
  --help[=on|off]                 print help and exit [off]
  --version[=on|off]              print version and exit [off]
  --config-file=FILENAME          File containing command line options
  --luajit-cmd=STRING             perform LuaJIT control command. This option is equivalent to 'luajit -j'. See LuaJIT documentation for more information

#上面是一些通用的配置信息,在具体测试某个测试时,会再详细说明参数设置
首先来进行IO测试
[root@test3 ~]# sysbench fileio help               #查看IO测试的文档
sysbench 1.1.0 (using bundled LuaJIT 2.1.0-beta3)

fileio options:
  --file-num=N                  number of files to create [128]              #文件的数量
  --file-block-size=N           block size to use in all IO operations [16384] #文件块的大小,如果要是针对INNODB的测试,可以设置为innodb_page_size的大小
  --file-total-size=SIZE        total size of files to create [2G]             #文件的总大小
  --file-test-mode=STRING       test mode {seqwr【顺序写】, seqrewr【顺序读写】, seqrd【顺序读】, rndrd【随机读】, rndwr【随机写】, rndrw【随机读写】} #文件测试模式
  --file-io-mode=STRING         file operations mode {sync【同步】,async【异步】,mmap【map映射】} [默认为:sync]          #文件的io模式
  --file-async-backlog=N        number of asynchronous operatons to queue per thread [128] #打开文件时的选项,这是与API相关的参数。
  --file-extra-flags=[LIST,...] #打开文件时的选项,这是与API相关的参数。可选有sync,dsync,direct。--file-fsync-freq=N           #执行fsync函数的频率,fsync主要是同步磁盘文件,因为可能有系统和磁盘缓冲的关系。默认为100,如果为0表示不使用fsync。
  --file-fsync-all[=on|off]     #每执行完一次写操作,就执行一次fsync,默认未off。--file-fsync-end[=on|off]     #在测试结束时,执行fsync,默认为on。--file-fsync-mode=STRING      #文件同步函数的选择,同样是和API相关的参数,由于多个操作对fdatasync支持的不同,因此不建议使用fdatasync。默认为fsync。--file-merged-requests=N      #尽可能合并此数量的io请求(0-不合并),默认为[0]。
  --file-rw-ratio=N             #测试时的读写比例,默认是2:1。
在使用sysbench进行测试的时候,通常分为三个步骤prepare,run,cleanup阶段。
第一步准备数据(prepare阶段):
[root@test3 systext]# sysbench fileio --file-num=10 --file-total-size=50G prepare
sysbench 1.1.0 (using bundled LuaJIT 2.1.0-beta3)

10 files, 5242880Kb each, 51200Mb total
Creating files for the test...
Extra file open flags: (none)
Creating file test_file.0
Creating file test_file.1
Creating file test_file.2
Creating file test_file.3
Creating file test_file.4
Creating file test_file.5
Creating file test_file.6
Creating file test_file.7
Creating file test_file.8
Creating file test_file.9
53687091200 bytes written in 489.55 seconds (104.59 MiB/sec).

#这里给出一个每秒写入的数据量104.59MB/s, 这里的写入是顺序写入的,表示磁盘的吞吐量为104.59MB/s。
【一般对顺序的读写称为吞吐量,对随机的IO使用IOPS来表示】
[root@test3 systext]# ll -h      #文件大小为5个G
total 50G
-rw------- 1 root root 5.0G Nov 27 09:30 test_file.0
-rw------- 1 root root 5.0G Nov 27 09:31 test_file.1
-rw------- 1 root root 5.0G Nov 27 09:32 test_file.2
-rw------- 1 root root 5.0G Nov 27 09:32 test_file.3
-rw------- 1 root root 5.0G Nov 27 09:33 test_file.4
-rw------- 1 root root 5.0G Nov 27 09:34 test_file.5
-rw------- 1 root root 5.0G Nov 27 09:35 test_file.6
-rw------- 1 root root 5.0G Nov 27 09:36 test_file.7
-rw------- 1 root root 5.0G Nov 27 09:36 test_file.8
-rw------- 1 root root 5.0G Nov 27 09:37 test_file.9
数据准备好之后,进行测试:
#这里进行随机读写测试
[root@test3 systext]# sysbench fileio --file-num=10 --file-total-size=50G --file-block-size=16384 --file-test-mode=rndrw --file-io-mode=sync --file-extra-flags=direct --time=100  --threads=16 --report-interval=10 run
sysbench 1.1.0 (using bundled LuaJIT 2.1.0-beta3)

Running the test with following options:     #设定的一些参数数值
Number of threads: 16
Report intermediate results every 10 second(s)
Initializing random number generator from current time


Extra file open flags: directio
10 files, 5GiB each
50GiB total file size
Block size 16KiB
Number of IO requests: 0
Read/Write ratio for combined random IO test: 1.50
Periodic FSYNC enabled, calling fsync() each 100 requests.
Calling fsync() at the end of test, Enabled.
Using synchronous I/O mode
Doing random r/w test
Initializing worker threads...

Threads started!

[ 10s ] reads: 3.24 MiB/s writes: 2.16 MiB/s fsyncs: 34.08/s latency (ms,95%): 80.025       #每隔10s输出一次报告
[ 20s ] reads: 3.49 MiB/s writes: 2.32 MiB/s fsyncs: 36.70/s latency (ms,95%): 73.135
[ 30s ] reads: 3.45 MiB/s writes: 2.29 MiB/s fsyncs: 37.00/s latency (ms,95%): 75.817
[ 40s ] reads: 3.43 MiB/s writes: 2.29 MiB/s fsyncs: 36.00/s latency (ms,95%): 75.817
[ 50s ] reads: 3.57 MiB/s writes: 2.38 MiB/s fsyncs: 37.40/s latency (ms,95%): 73.135
[ 60s ] reads: 3.08 MiB/s writes: 2.06 MiB/s fsyncs: 32.30/s latency (ms,95%): 86.002
[ 70s ] reads: 3.41 MiB/s writes: 2.27 MiB/s fsyncs: 36.40/s latency (ms,95%): 75.817
[ 80s ] reads: 3.47 MiB/s writes: 2.31 MiB/s fsyncs: 36.20/s latency (ms,95%): 73.135
[ 90s ] reads: 3.46 MiB/s writes: 2.31 MiB/s fsyncs: 36.20/s latency (ms,95%): 77.194
[ 100s ] reads: 3.10 MiB/s writes: 2.07 MiB/s fsyncs: 33.50/s latency (ms,95%): 75.817

Throughput:
         read:  IOPS=215.57 3.37 MiB/s (3.53 MB/s)    #通常的机械磁盘随机IOPS也就是200多一点。
         write: IOPS=143.72 2.25 MiB/s (2.35 MB/s)    #随机写入的速度明显要低很多。
         fsync: IOPS=37.13

Latency (ms):
         min:                                  0.08
         avg:                                 40.51
         max:                               1000.31
         95th percentile:                     77.19
         sum:                            1601329.71

#随机读大概是2.10M/s,文件块的大小为16KB,可以大概估计磁盘转速: 2.10*1024KB*60s/16KB=7560n/m, 大概就是7500转每分


[root@test3 systext]# sysbench fileio --file-num=10 --file-total-size=50G --file-block-size=16384 --file-test-mode=seqrd --file-io-mode=sync --file-extra-flags=direct --time=100  --threads=16 --report-interval=10 run
sysbench 1.1.0 (using bundled LuaJIT 2.1.0-beta3)

Running the test with following options:
Number of threads: 16
Report intermediate results every 10 second(s)
Initializing random number generator from current time


Extra file open flags: directio
10 files, 5GiB each
50GiB total file size
Block size 16KiB
Periodic FSYNC enabled, calling fsync() each 100 requests.
Calling fsync() at the end of test, Enabled.
Using synchronous I/O mode
Doing sequential read test
Initializing worker threads...

Threads started!

[ 10s ] reads: 98.88 MiB/s writes: 0.00 MiB/s fsyncs: 0.00/s latency (ms,95%): 3.020
[ 20s ] reads: 98.64 MiB/s writes: 0.00 MiB/s fsyncs: 0.00/s latency (ms,95%): 3.681
[ 30s ] reads: 93.24 MiB/s writes: 0.00 MiB/s fsyncs: 0.00/s latency (ms,95%): 2.913
[ 40s ] reads: 89.12 MiB/s writes: 0.00 MiB/s fsyncs: 0.00/s latency (ms,95%): 4.028
[ 50s ] reads: 93.17 MiB/s writes: 0.00 MiB/s fsyncs: 0.00/s latency (ms,95%): 4.487
[ 60s ] reads: 91.98 MiB/s writes: 0.00 MiB/s fsyncs: 0.00/s latency (ms,95%): 4.652
[ 70s ] reads: 97.08 MiB/s writes: 0.00 MiB/s fsyncs: 0.00/s latency (ms,95%): 3.425
[ 80s ] reads: 93.71 MiB/s writes: 0.00 MiB/s fsyncs: 0.00/s latency (ms,95%): 3.020
[ 90s ] reads: 94.63 MiB/s writes: 0.00 MiB/s fsyncs: 0.00/s latency (ms,95%): 3.304
[ 100s ] reads: 89.57 MiB/s writes: 0.00 MiB/s fsyncs: 0.00/s latency (ms,95%): 3.364

Throughput:
         read:  IOPS=6016.01 94.00 MiB/s (98.57 MB/s)
         write: IOPS=0.00 0.00 MiB/s (0.00 MB/s)
         fsync: IOPS=0.00

Latency (ms):
         min:                                  0.40
         avg:                                  2.66
         max:                                687.00
         95th percentile:                      3.62
         sum:                            1599247.42

#测试结果可以看到顺序的读和随机读的差距还是超大的
可以更改--file-test-mode的模式,改变测试的模式。
测试阶段完成之后,需要进行最后的cleanup阶段,
[root@test3 systext]# sysbench fileio --file-num=10 --file-total-size=50 cleanup
sysbench 1.1.0 (using bundled LuaJIT 2.1.0-beta3)

Removing test files...
[root@test3 systext]# ls
[root@test3 systext]# df -h
Filesystem      Size  Used Avail Use% Mounted on
/dev/vda3        29G  8.4G   20G  31% /
tmpfs           3.9G   44K  3.9G   1% /dev/shm
/dev/vda1       190M   30M  151M  17% /boot
/dev/vdb        100G   25G   76G  25% /data
cgroup_root     3.9G     0  3.9G   0% /cgroup
#看到磁盘空间已经释放
测试MySQL的OLTP
sysbench新版的用法和之前的旧版本有所不同,先来看测试数据库时的一些参数:
General database options:

  --db-driver=STRING  specifies database driver to use ('help' to get list of available drivers) [mysql] #指定数据库驱动,默认是mysql
  --db-ps-mode=STRING prepared statements usage mode {auto, disable} [auto]                              #
  --db-debug[=on|off] print database-specific debug information [off]                                    #dubug模式


Compiled-in database drivers:
  mysql - MySQL driver

mysql options:
  --mysql-host=[LIST,...]          MySQL server host [localhost]
  --mysql-port=[LIST,...]          MySQL server port [3306]
  --mysql-socket=[LIST,...]        MySQL socket
  --mysql-user=STRING              MySQL user [sbtest]
  --mysql-password=STRING          MySQL password []
  --mysql-db=STRING                MySQL database name [sbtest]              #数据库名字,默认是sbtest
  --mysql-ssl[=on|off]             use SSL connections, if available in the client library [off]  #以下是ssl的连接测试
  --mysql-ssl-key=STRING           path name of the client private key file
  --mysql-ssl-ca=STRING            path name of the CA file
  --mysql-ssl-cert=STRING          path name of the client public key certificate file
  --mysql-ssl-cipher=STRING        use specific cipher for SSL connections []
  --mysql-compression[=on|off]     use compression, if available in the client library [off]      #压缩测试
  --mysql-debug[=on|off]           trace all client library calls [off]
  --mysql-ignore-errors=[LIST,...] list of errors to ignore, or "all" [1213,1020,1205]            #忽略的错误
  --mysql-dry-run[=on|off]         Dry run, pretend that all MySQL client API calls are successful without executing them [off]
MySQL测试的lua脚本:
#因为是源码安装,索引目录在这里
[root@test3 lua]# pwd
/data/sysbench-master/src/lua
[root@test3 lua]# ls
bulk_insert.lua  Makefile     oltp_common.lua  oltp_point_select.lua  oltp_update_index.lua      prime-test.lua
empty-test.lua   Makefile.am  oltp_delete.lua  oltp_read_only.lua     oltp_update_non_index.lua  select_random_points.lua
internal         Makefile.in  oltp_insert.lua  oltp_read_write.lua    oltp_write_only.lua        select_random_ranges.lua
#根据脚本的名字可以选择对应的基本
#查看某个lua脚本的用法
[root@test3 lua]# sysbench oltp_common.lua help
sysbench 1.1.0 (using bundled LuaJIT 2.1.0-beta3)

oltp_common.lua options:
  --auto_inc[=on|off]           Use AUTO_INCREMENT column as Primary Key (for MySQL), or its alternatives in other DBMS. When disabled, use client-generated IDs [on]
  --create_secondary[=on|off]   Create a secondary index in addition to the PRIMARY KEY [on]
  --create_table_options=STRING Extra CREATE TABLE options []
  --delete_inserts=N            Number of DELETE/INSERT combinations per transaction [1]
  --distinct_ranges=N           Number of SELECT DISTINCT queries per transaction [1]
  --index_updates=N             Number of UPDATE index queries per transaction [1]
  --mysql_storage_engine=STRING Storage engine, if MySQL is used [innodb]
  --non_index_updates=N         Number of UPDATE non-index queries per transaction [1]
  --order_ranges=N              Number of SELECT ORDER BY queries per transaction [1]
  --pgsql_variant=STRING        Use this PostgreSQL variant when running with the PostgreSQL driver. The only currently supported variant is 'redshift'. When enabled, create_secondary is automatically disabled, and delete_inserts is set to 0
  --point_selects=N             Number of point SELECT queries per transaction [10]
  --range_selects[=on|off]      Enable/disable all range SELECT queries [on]
  --range_size=N                Range size for range SELECT queries [100]
  --secondary[=on|off]          Use a secondary index in place of the PRIMARY KEY [off]
  --simple_ranges=N             Number of simple range SELECT queries per transaction [1]
  --skip_trx[=on|off]           Don't start explicit transactions and execute all queries in the AUTOCOMMIT mode [off]
  --sum_ranges=N                Number of SELECT SUM() queries per transaction [1]
  --table_size=N                Number of rows per table [10000]
  --tables=N                    Number of tables [1]
prepare阶段:
创建默认的测试库:
mysql> create database sbtest;      #创建数据库
Query OK, 1 row affected (0.11 sec)

#准备数据,时间比较长,可以把table_size设置的小一点
[root@test3 lua]# sysbench /data/sysbench-master/src/lua/oltp_read_write.lua --tables=3 --table_size=10000000 --mysql-user=root --mysql-password=123456 --mysql-host=10.0.102.214 --mysql-port=3306 --mysql-db=sbtest prepare
sysbench 1.1.0 (using bundled LuaJIT 2.1.0-beta3)

Creating table 'sbtest1'...
Inserting 10000000 records into 'sbtest1'
Creating a secondary index on 'sbtest1'...
Creating table 'sbtest2'...
Inserting 10000000 records into 'sbtest2'
Creating a secondary index on 'sbtest2'...
Creating table 'sbtest3'...
Inserting 10000000 records into 'sbtest3'
Creating a secondary index on 'sbtest3'...

#在MySQL  shel1中查看数据
mysql> select count(*) from sbtest1;
+----------+
| count(*) |
+----------+
| 10000000 |
+----------+
1 row in set (1.89 sec)

mysql> show tables;
+------------------+
| Tables_in_sbtest |
+------------------+
| sbtest1          |
| sbtest2          |
| sbtest3          |
+------------------+
3 rows in set (0.00 sec)
run阶段
选择一个合适的lua脚本进行测试:
[root@test3 lua]# sysbench /data/sysbench-master/src/lua/oltp_point_select.lua --tables=3 --table_size=10000000 --mysql-user=root --mysql-password=123456 --mysql-host=10.0.102.214 --mysql-port=3306 --mysql-db=sbtest --threads=128 --time=100 --report-interval=5 run
sysbench 1.1.0 (using bundled LuaJIT 2.1.0-beta3)

Running the test with following options:
Number of threads: 128
Report intermediate results every 5 second(s)
Initializing random number generator from current time


Initializing worker threads...

Threads started!

[ 5s ] thds: 128 tps: 15037.47 qps: 15037.47 (r/w/o: 15037.47/0.00/0.00) lat (ms,95%): 41.10 err/s: 0.00 reconn/s: 0.00
[ 10s ] thds: 128 tps: 18767.43 qps: 18767.43 (r/w/o: 18767.43/0.00/0.00) lat (ms,95%): 46.63 err/s: 0.00 reconn/s: 0.00
[ 15s ] thds: 128 tps: 22463.68 qps: 22463.68 (r/w/o: 22463.68/0.00/0.00) lat (ms,95%): 40.37 err/s: 0.00 reconn/s: 0.00
[ 20s ] thds: 128 tps: 26848.42 qps: 26848.42 (r/w/o: 26848.42/0.00/0.00) lat (ms,95%): 28.67 err/s: 0.00 reconn/s: 0.00
[ 25s ] thds: 128 tps: 27005.57 qps: 27005.57 (r/w/o: 27005.57/0.00/0.00) lat (ms,95%): 15.00 err/s: 0.00 reconn/s: 0.00
[ 30s ] thds: 128 tps: 26965.62 qps: 26965.62 (r/w/o: 26965.62/0.00/0.00) lat (ms,95%): 1.82 err/s: 0.00 reconn/s: 0.00
[ 35s ] thds: 128 tps: 27626.74 qps: 27626.74 (r/w/o: 27626.74/0.00/0.00) lat (ms,95%): 0.42 err/s: 0.00 reconn/s: 0.00
[ 40s ] thds: 128 tps: 27244.27 qps: 27244.27 (r/w/o: 27244.27/0.00/0.00) lat (ms,95%): 0.33 err/s: 0.00 reconn/s: 0.00
[ 45s ] thds: 128 tps: 26522.56 qps: 26522.56 (r/w/o: 26522.56/0.00/0.00) lat (ms,95%): 1.42 err/s: 0.00 reconn/s: 0.00
[ 50s ] thds: 128 tps: 26791.43 qps: 26791.43 (r/w/o: 26791.43/0.00/0.00) lat (ms,95%): 5.57 err/s: 0.00 reconn/s: 0.00
[ 55s ] thds: 128 tps: 27088.42 qps: 27088.42 (r/w/o: 27088.42/0.00/0.00) lat (ms,95%): 1.42 err/s: 0.00 reconn/s: 0.00
[ 60s ] thds: 128 tps: 28056.06 qps: 28056.06 (r/w/o: 28056.06/0.00/0.00) lat (ms,95%): 0.22 err/s: 0.00 reconn/s: 0.00
[ 65s ] thds: 128 tps: 27296.11 qps: 27296.11 (r/w/o: 27296.11/0.00/0.00) lat (ms,95%): 0.73 err/s: 0.00 reconn/s: 0.00
[ 70s ] thds: 128 tps: 28621.60 qps: 28621.60 (r/w/o: 28621.60/0.00/0.00) lat (ms,95%): 0.19 err/s: 0.00 reconn/s: 0.00
[ 75s ] thds: 128 tps: 28992.29 qps: 28992.29 (r/w/o: 28992.29/0.00/0.00) lat (ms,95%): 0.19 err/s: 0.00 reconn/s: 0.00
[ 80s ] thds: 128 tps: 28279.88 qps: 28279.88 (r/w/o: 28279.88/0.00/0.00) lat (ms,95%): 0.20 err/s: 0.00 reconn/s: 0.00
[ 85s ] thds: 128 tps: 28612.84 qps: 28612.84 (r/w/o: 28612.84/0.00/0.00) lat (ms,95%): 0.20 err/s: 0.00 reconn/s: 0.00
[ 90s ] thds: 128 tps: 28031.47 qps: 28031.47 (r/w/o: 28031.47/0.00/0.00) lat (ms,95%): 0.20 err/s: 0.00 reconn/s: 0.00
[ 95s ] thds: 128 tps: 28734.66 qps: 28734.66 (r/w/o: 28734.66/0.00/0.00) lat (ms,95%): 0.20 err/s: 0.00 reconn/s: 0.00
[ 100s ] thds: 128 tps: 28767.20 qps: 28767.20 (r/w/o: 28767.20/0.00/0.00) lat (ms,95%): 2.39 err/s: 0.00 reconn/s: 0.00
SQL statistics:
    queries performed:
        read:                            2638920   #总的select数量
        write:                           0
        other:                           0
        total:                           2638920
    transactions:                        2638920 (26382.71 per sec.)   #TPS
    queries:                             2638920 (26382.71 per sec.)   #QPS
    ignored errors:                      0      (0.00 per sec.)        #忽略的错误
    reconnects:                          0      (0.00 per sec.)        #重新连接

Throughput:
    events/s (eps):                      26382.7081                   #每秒的事件数,一般和TPS一样
    time elapsed:                        100.0246s                    #测试的总时间
    total number of events:              2638920                      #总的事件数,一般和TPS一样

Latency (ms):
         min:                                    0.11          #最小响应时间
         avg:                                    4.85          #平均响应时间
         max:                                  649.29          #最大响应时间
         95th percentile:                       25.74          #95%的响应时间是这个数据
         sum:                             12796148.28

Threads fairness:
    events (avg/stddev):           20616.5625/196.08
    execution time (avg/stddev):   99.9699/0.00

#在这个测试中,可以看到TPS与QPS的大小基本一致,说明这个lua脚本中的一个查询一般就是一个事务!
我们一般关注的指标主要有:
- response time avg:平均响应时间(后面的95%的大小可以通过–percentile=98的方式去更改)。
- transactions:精确的说是这一项后面的TPS,但如果使用了–skip-trx=on,这项事务数为0,需要用total number of events去除以总时间,得到tps(其实还可以分为读tps和写tps)。
- queries:用它除以总时间,得到吞吐量QPS。
因为上面的TPS与QPS是一样的,因此只绘了TPS的图,如下:
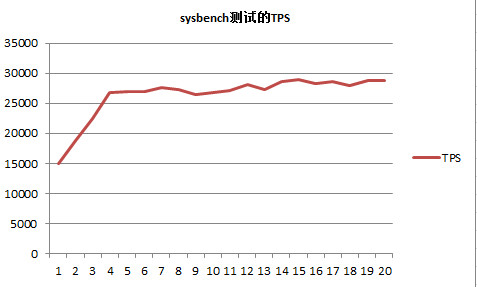
刚开始的时候有一个明显的上升,这时候是因为在bp中没有缓存数据,需要从磁盘中读数据,也就是预热阶段!
清理数据
[root@test3 lua]# sysbench /data/sysbench-master/src/lua/oltp_read_write.lua --tables=3 --table_size=10000000 --mysql-user=root --mysql-password=123456 --mysql-host=10.0.102.214 --mysql-port=3306 --mysql-db=sbtest cleanup
sysbench 1.1.0 (using bundled LuaJIT 2.1.0-beta3)

Dropping table 'sbtest1'...
Dropping table 'sbtest2'...
Dropping table 'sbtest3'...
[root@test3 lua]#
sysbench除了以上的测试之外,还可以测试:
Compiled-in tests:
  fileio - File I/O test
  cpu - CPU performance test
  memory - Memory functions speed test
  threads - Threads subsystem performance test
  mutex - Mutex performance test

See 'sysbench <testname> help' for a list of options for each test