%matplotlib inline

import matplotlib as mpl

import  matplotlib.pyplot as plt

import numpy as np

import pandas as pd
#首先导入基本的画图包,第一句是必要的
house = pd.read_csv('./housing.csv') # 读取数据,数据文件存放在c根目录下盘可直接这样访问,如果放在文件夹里。可像平常一样加上目录名称
house.describe().loc[['min', 'std', 'max', 'mean'], ['RM', 'MEDV']].round(2) 求均值方差等
可得到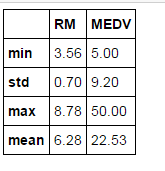
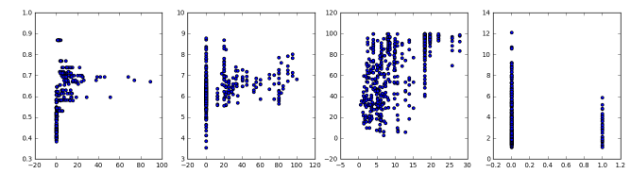
for i in range(4):
print (house.iloc[:, i].corr(house.iloc[:, i+4]).round(2))  #  可得到相关系数
fig, axes = plt.subplots(1, 4, figsize = (16, 4))
for n in range(4):
axes[n].scatter(house.iloc[:, n],house.iloc[:, n+4])  ## 这里开始画图
- 基本概念
- figure:画布
- axes: 坐标轴,或者理解成所画的图形
- 一张画布(figure)可以有很多图(axes)
- 其他
- label: 坐标上的标注
- tickets: 刻度
- legend:图例
- loc = 0: 自动寻找最好的位置
- ncol = 3:分三列
- fontsize
- frameon = True: 边框
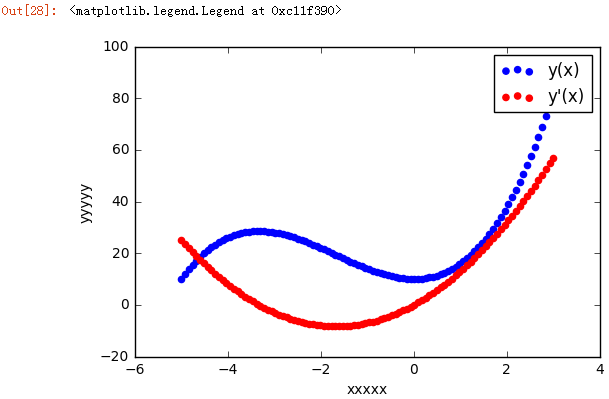
fig, ax = plt.subplots()
ax.plot(x, y1, color = "blue", label = "y(x)")
ax.plot(x, y2, color = "red", label = "y'(x)")
ax.set_xlabel("xxxxx")
ax.set_ylabel("yyyyy")
ax.legend()    # 基本画线图

fig, ax = plt.subplots()
ax.scatter(x, y1, color = "blue", label = "y(x)")
ax.scatter(x, y2, color = "red", label = "y'(x)")
ax.set_xlabel("xxxxx")
ax.set_ylabel("yyyyy")
ax.legend()  #基本画点图
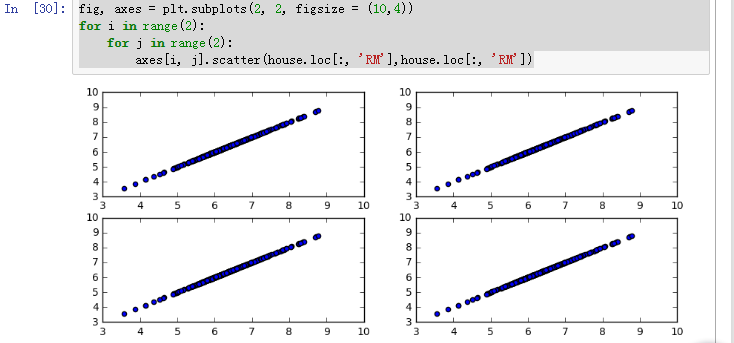
fig, axes = plt.subplots(2, 2, figsize = (10,4))
for i in range(2):
for j in range(2):
axes[i, j].scatter(house.loc[:, 'RM'],house.loc[:, 'RM'])
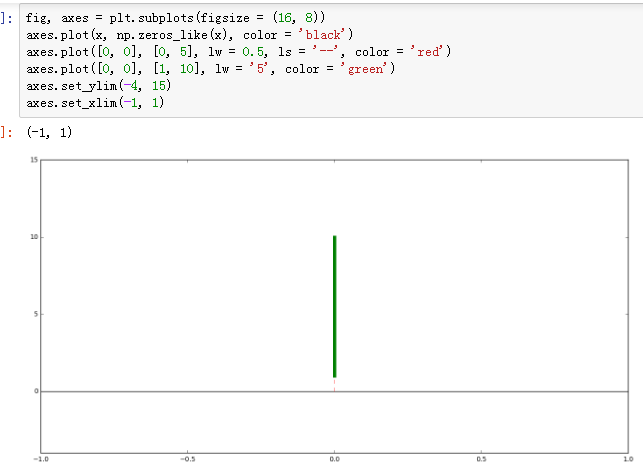
fig, axes = plt.subplots(figsize = (16, 8))
axes.plot(x, np.zeros_like(x), color = 'black')
axes.plot([0, 0], [0, 5], lw = 0.5, ls = '--', color = 'red')
axes.plot([0, 0], [1, 10], lw = '5', color = 'green')
axes.set_ylim(4, 15)
axes.set_xlim(-1, 1)
fig, ax = plt.subplots(figsize = (10,4))
ax.plot(x, y1, lw = 1.5, color = 'blue', label = 'Sy(x)s')
ax.plot(x, y2, lw = 1.5, color = 'red', label = 'Sy(x)s')
ax.plot(x, y2, lw = 1.5, color = 'green', label = 'Sy''(x)s')
ax.plot(x, np.zeros_like(x), lw = 0.5, color = 'black')
ax.plot([-3.33, -3.33], [0, (-3,33)**3 + 5*(-3.33)*2 + 10], ls = '--', lw = 0.5, color = 'black')
ax.plot([0, 0], [0, 10], lw = 0.5, ls = '--', color = 'black')
ax.plot([0], [10], lw = 0.5, marker = 'o', color = 'blue')
ax.plot([-3.33], [(-3.33)**3 + 5*(-3.33)**2 + 10], lw = 0.5, marker = 'o', color = 'blue')
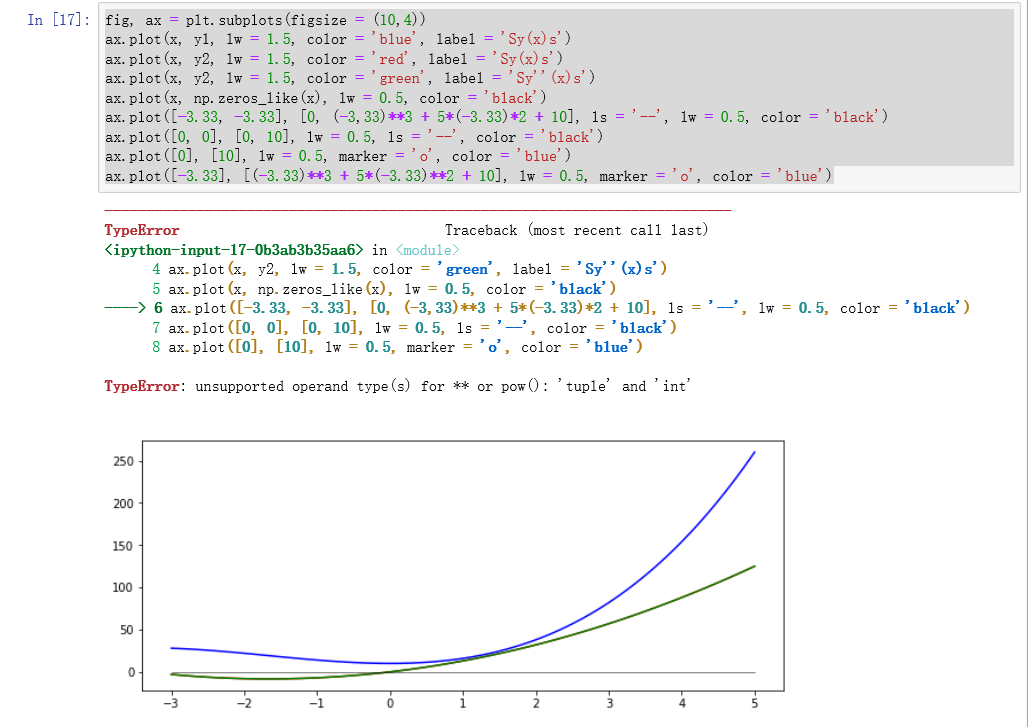
fig = plt.figure(figsize = (8, 2.5), facecolor = "#f1f1f1")
left, bottom, width, height = 0.1, 0.1, 0.8, 0.8
ax = fig.add_axes((left, bottom, width, height), facecolor = "#e1e1e1")
x = np.linspace(-2, 2, 1000)
y1 = np.cos(40*x)
y2 = np.exp(-x*2)
ax.plot(x, y1*y2)
ax.plot(x, y2, 'g')
ax.plot(x, -y2, 'g')
ax.set_xlabel("x")
ax.set_ylabel("y")

fig.savefig("graph.png", dpi = 100, facecolor = "#f1f1f1")
fig.savefig("graph.pdf", dpi = 300, facecolor = "#f1f1f1")

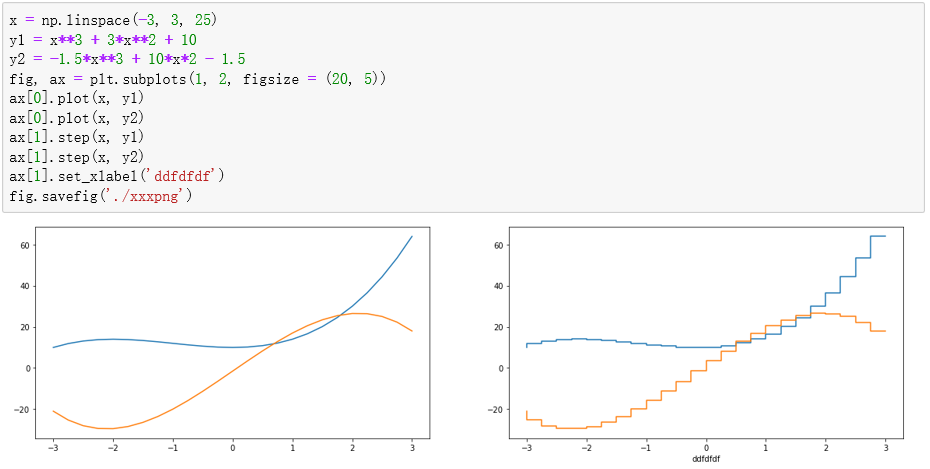
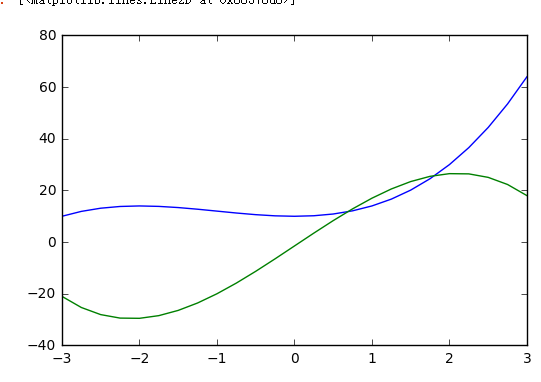
x = np.linspace(-3, 3, 25)
y1 = x**3 + 3*x**2 + 10
y2 = -1.5*x**3 + 10*x*2 - 1.5
fig, ax = plt.subplots(1, 2, figsize = (20, 5))
ax[0].plot(x, y1)
ax[0].plot(x, y2)
ax[1].step(x, y1)
ax[1].step(x, y2)
ax[1].set_xlabel('ddfdfdf')
fig.savefig('./xxxpng')
fignum = 0
x = np.linspace(-3, 3, 25)
y1 = x**3 + 3*x**2 + 10
y2 = -1.5*x**3 + 10*x*2 - 1.5
fig, ax = plt.subplots()
ax.plot(x, y1)
ax.plot(x, y2)
def hide_label(fig, ax):
global fignum
ax.set_xtickets([])
ax.set_yticks([])
ax.xaxis.set
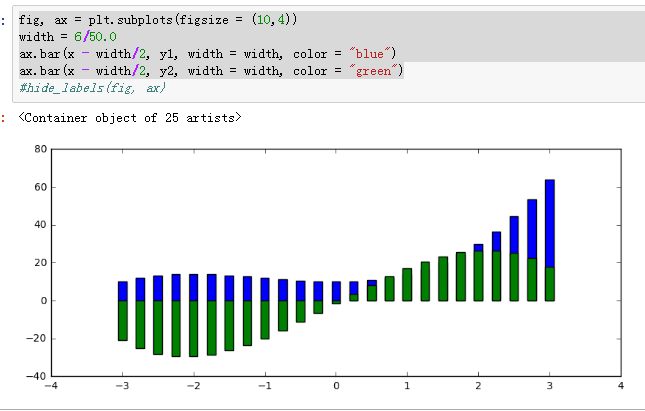
fig, ax = plt.subplots(figsize = (10,4))
width = 6/50.0
ax.bar(x - width/2, y1, width = width, color = "blue")
ax.bar(x - width/2, y2, width = width, color = "green")
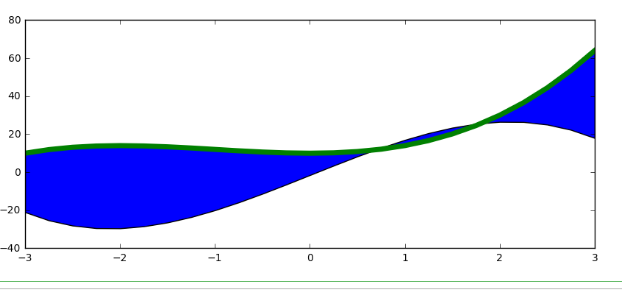
fig, ax = plt.subplots(figsize = (10,4))
ax.fill_between(x, y1, y2)
ax.plot(x, y1, color = 'green', lw = 5)
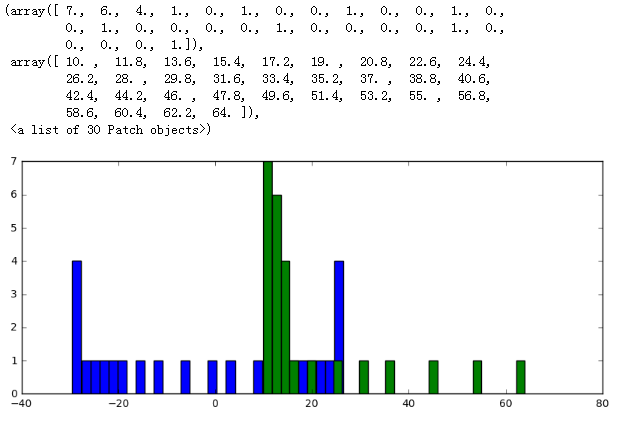
fig, ax = plt.subplots(figsize = (10,4))
ax.hist(y2, bins = 30)
ax.hist(y1, bins = 30)
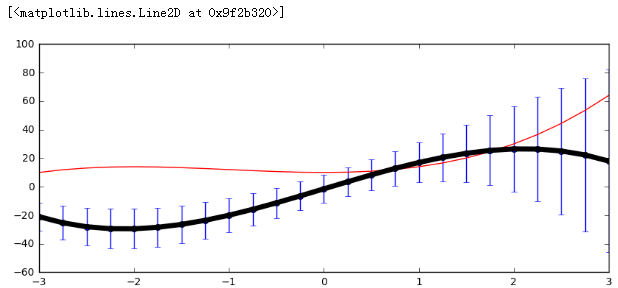
fig, ax = plt.subplots(figsize = (10,4))
ax.errorbar(x, y2, yerr = y1, fmt = 'o-')
ax.plot(x, y1, color = 'red')
ax.plot(x, y2, color = 'black', lw = 5)
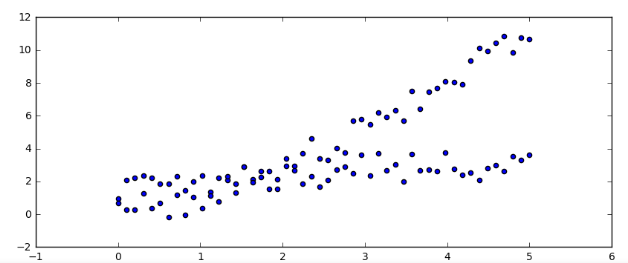
fig, ax = plt.subplots(figsize = (10,4))
x = np.linspace(0, 5, 50)
ax.scatter(x, -1 + x + 0.25*x**2 + 2*np.random.rand(len(x)))
ax.scatter(x, np.sqrt(x) + 2*np.random.rand(len(x)))

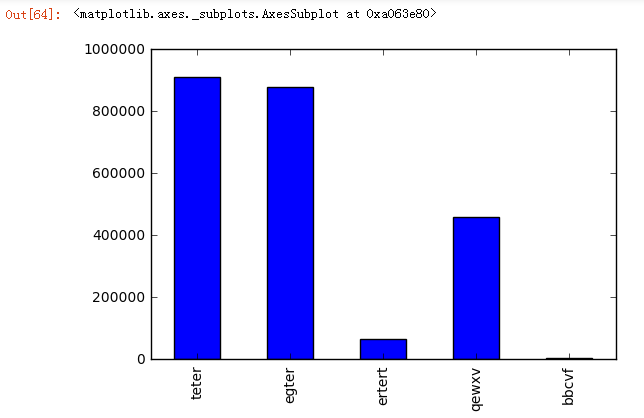
s.plot(kind = 'bar')
s.plot(kind = 'pie') # 画饼状图
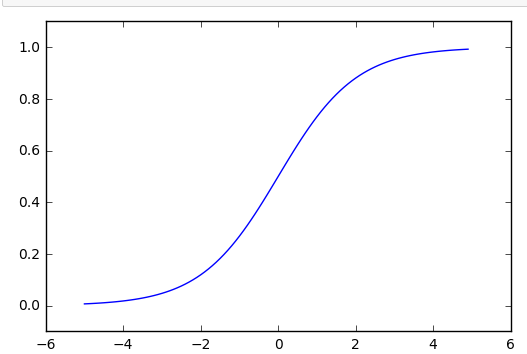
import matplotlib.pyplot as  plt
%matplotlib inline
def sigmoid(x):
    return 1/(1+np.exp(-x))
x = np.arange(-5.0, 5.0 ,0.1)
y = sigmoid(x)
plt.plot(x ,y)
plt.ylim(-0.1, 1.1)
plt.show()
a = np.array([[1, 2, 3], [4, 5, 6]])
b = np.array([[1 ,2], [3, 4], [5, 6]])
np.dot(a, b)
#X--------Y
W2 = np.array([[1, 2], [3, 4] ,[5, 6]])
W1 = np.array([[1, 2, 3], [4, 5, 6]])
W3 = np.array([[1, 2], [3, 4]])

b1 = np.array([1, 2, 3])
b2 = np.array([1, 2])
b3 = np.array([1, 2])

X = np.array([1.0, 2.0])
A1 = np.dot(X ,W1) + b1
A2 = np.dot(A1, W2) + b2
Y = np.dot(A2, W3) + b3
#and门
def and_gate(x1, x2):
    if (20*x1 + 20*x2 -30) > 0:
        return 1
    else:
        return 0
x1, x2 = 1, 1
and_gate(x1, x2)