一、查看CPU信息
1、cpu信号
[root@master config]# cat /proc/cpuinfo |grep name |cut -f2 -d: | uniq
 Intel(R) Core(TM) i5-4200U CPU @ 1.60GHz
2、物理CPU个数
[root@master config]# cat /proc/cpuinfo |grep physical |sort |uniq -c
      2 address sizes   : 43 bits physical, 48 bits virtual
      2 physical id     : 0  #一个物理cpu
3、每个物理CPU的核数
[root@master config]# cat /proc/cpuinfo |grep 'cpu cores' |uniq
cpu cores       : 2 #两个物理核封装在同一个Cpu里面
4、是否使用了超线程
[root@master config]# cat /proc/cpuinfo |grep 'processor' |wc -l
2
#共两个逻辑CPU
二、查看内存信息
[root@master config]# free -g
              total        used        free      shared  buff/cache   available
Mem:              2           0           2           0           0           2
Swap:             2           0           2
[root@master config]# free -m
              total        used        free      shared  buff/cache   available
Mem:           2831         555        2062           8         213        2100
Swap:          2559           0        2559
[root@master config]# cat /proc/meminfo
重要指标说明:
total:内存总量
used:表示总计分配给缓存(包含buffers 与cache )使用的数量,但其中可能部分缓存并未实际使用
free:未分配的内存
buffers:系统分配但未被使用的buffers 数量
cached:系统分配但未被使用的cache 数量
-buffers/cache:反映的是被程序实实在在吃掉的内存【used - buffers - cached】
+buffers/cache:反映的是可以挪用的内存总数。【free + buffers + cached】
三、查看操作系统信息
1、查看操作系统版本信息
[root@master config]# cat /etc/redhat-release
CentOS Linux release 7.3.1611 (Core)
2、查看操作系统运行位数
[root@master config]# getconf LONG_BIT
64
四、查看网卡
1、查看整体网卡信息
[root@master config]# ifconfig
-bash: ifconfig: 未找到命令
安装工具包:yum -y install net-tools
或者
[root@master config]# ip link show
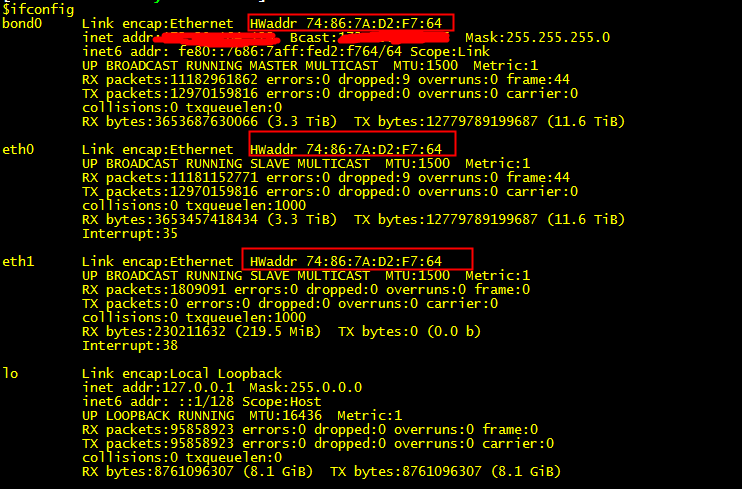
该机器中总共包含两块网卡eth0和eth1,lo表示本地地址;注意eth0和eth1绑定了相同的物理地址HWaddr,这里实质是通过Bonding 将多张网卡汇聚成一张,可以提供负载平衡(load-balancing),容错(fault-tolerance)等功能。
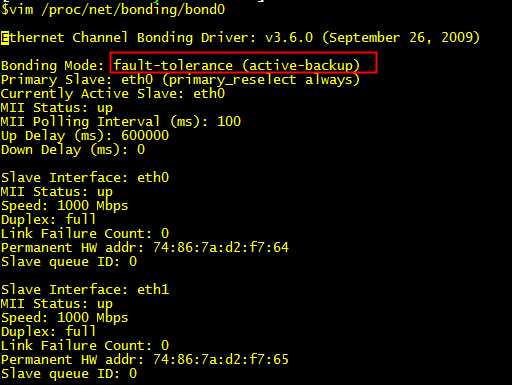
2、查看绑定模式
3、查看网卡速率
[root@master config]# ethtool ens33
Settings for ens33:
        Supported ports: [ TP ]
        Supported link modes:   10baseT/Half 10baseT/Full
                                100baseT/Half 100baseT/Full
                                1000baseT/Full
        Supported pause frame use: No
        Supports auto-negotiation: Yes
        Advertised link modes:  10baseT/Half 10baseT/Full
                                100baseT/Half 100baseT/Full
                                1000baseT/Full
        Advertised pause frame use: No
        Advertised auto-negotiation: Yes
        Speed: 1000Mb/s
        Duplex: Full
        Port: Twisted Pair
        PHYAD: 0
        Transceiver: internal
        Auto-negotiation: on
        MDI-X: off (auto)
        Supports Wake-on: d
        Wake-on: d
        Current message level: 0x00000007 (7)
                               drv probe link
        Link detected: yes
五、查看磁盘信息
[root@master config]# df
文件系统               1K-块    已用     可用 已用% 挂载点
/dev/mapper/cl-root 22529284 4100856 18428428   19% /
devtmpfs             1438764       0  1438764    0% /dev
tmpfs                1449740       0  1449740    0% /dev/shm
tmpfs                1449740    8740  1441000    1% /run
tmpfs                1449740       0  1449740    0% /sys/fs/cgroup
/dev/sda1            1038336  141592   896744   14% /boot
tmpfs                 289952       0   289952    0% /run/user/0
六、查看RAID卡信息
通过df命令,我们大体了解磁盘分区容量和使用情况,但具体每个分区是由哪些磁盘组成,我们并不清楚,通常情况下,为提高磁盘的可用性,我们都会对磁盘做RAID,查看RAID卡信息需要使用MegaCli命令,该命令位于/opt/MegaRAID/MegaCli
1、查看硬盘信息
sudo MegaCli64 -PDList -aALL | egrep '(Raw Size|Device Id|DiskGroup|DiskGroup|PD Type|Speed)'

解释:机器共用两块SAS接口盘,8块SATA接口的SSD硬盘。
2、查看RAID级别
sudo MegaCli64 -LDInfo -Lall -aALL | egrep '(RAID|Size)'
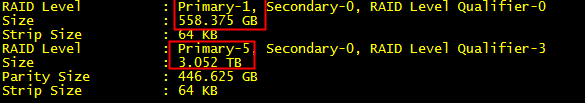
解释:机器上包含两种RAID策略,分别是RAID-1和RAID-5。
RAID-1容量:558G,日志盘【完全冗余,保证高可用】
RAID-5容量:3T,数据盘
RAID-1磁盘容量计算:磁盘容量/2
RAID-5磁盘容量计算:单个硬盘容量*(N-1),N>=3
结合前面显示的磁盘信息,很容易得到2块SAS盘做RAID-1,8块SSD盘做RAID-5
3、查看磁盘的缓存策略
sudo /opt/MegaRAID/MegaCli/MegaCli64 -LDGetProp -DskCache -LALL -aALL

解释:
为了保证数据的一致性,日志盘关闭磁盘写缓存;
为了提高写入效率,数据盘开启了磁盘写缓存。
4、查看I/O调度算法
[root@master config]# cat /sys/block/sda/queue/scheduler
noop [deadline] cfq